20021201
•You can also move the pointer to a particular point by inputting coordinates. Pressing
a number key displays a dialog box for inputting coordinates. Input the values you
want and then tap [OK].
•When there are multiple graphs on the Graph window, you can use the up and down
cursor keys or the up and down graph controller arrows to move the pointer between
graphs.
(5) To quit the trace operation, tap on the icon panel.
Tip
• While the trace pointer is on the window, tapping the displayed coordinate values causes the
coordinate values to appear in the message box. You can then copy the coordinates to the
clipboard.
k Specifying the Format of the Coordinates Displayed by Trace
Check boxes on the Graph Format dialog box (page 13-3-4) let you specify whether you
want to display pointer coordinates only, or pointer coordinates plus the derivative. You can
also turn off the display of the coordinates, if you want.
3-7-2
Using Trace
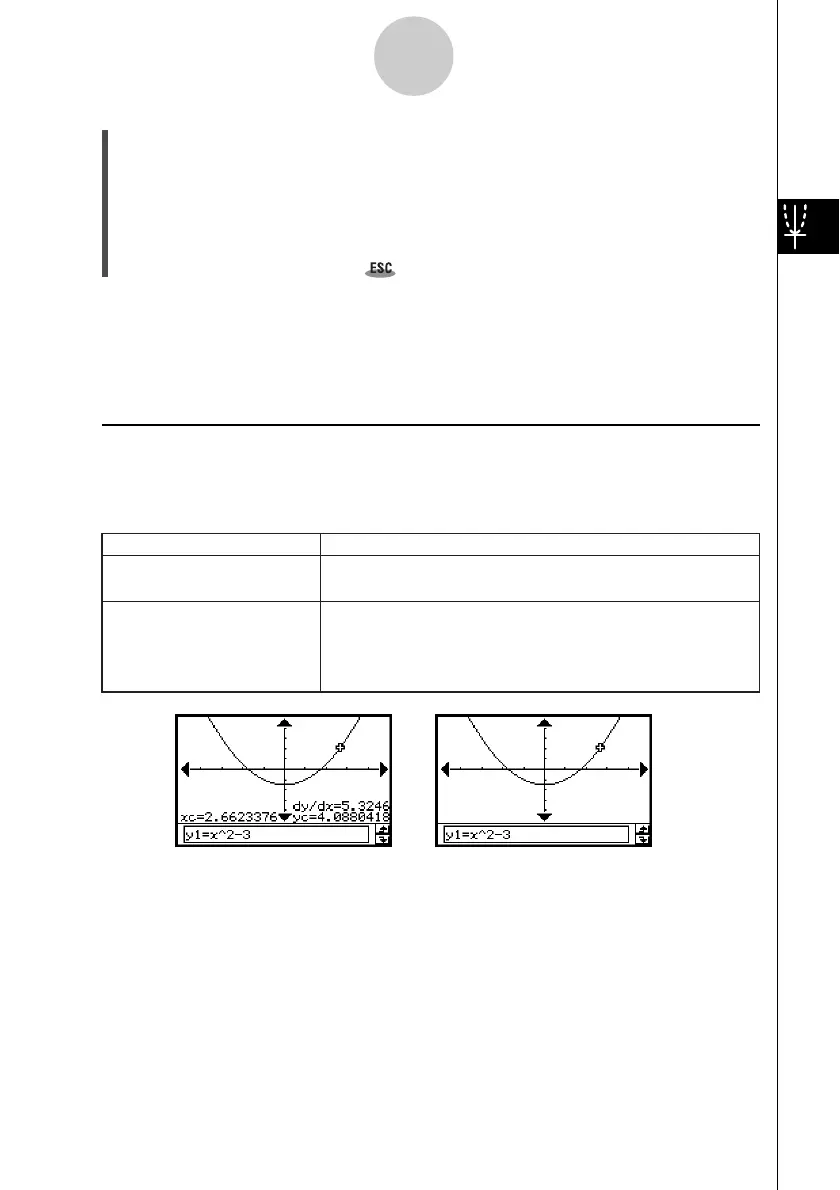
Tu rn off coordinate display
Display coordinates and the
derivative
Select the [Derivative/Slope] check box under
[Graph Format].
Clear the [Coordinate] check box under [Graph Format].
• Neither coordinates nor the derivative is displayed when
the [Coordinate] check box is cleared, regardless of the
current [Derivative/Slope] setting.
Do this:
To do this:
For details about Graph Format settings, see “13-3 Setup Menu Settings”.
 Loading...