20021201
7-4 Graphing Single-Variable Statistical Data
Single-variable data is data that consists of a single value. If you are trying to obtain the
average height of the members of a single class, for example, the single variable would be
height.
Single-variable statistics include distributions and sums. You can produce any of the graphs
described below using single-variable data.
Before trying to draw any of the graphs described below, configure the graph setup using the
procedures under “Configuring StatGraph Setups” on page 7-3-2.
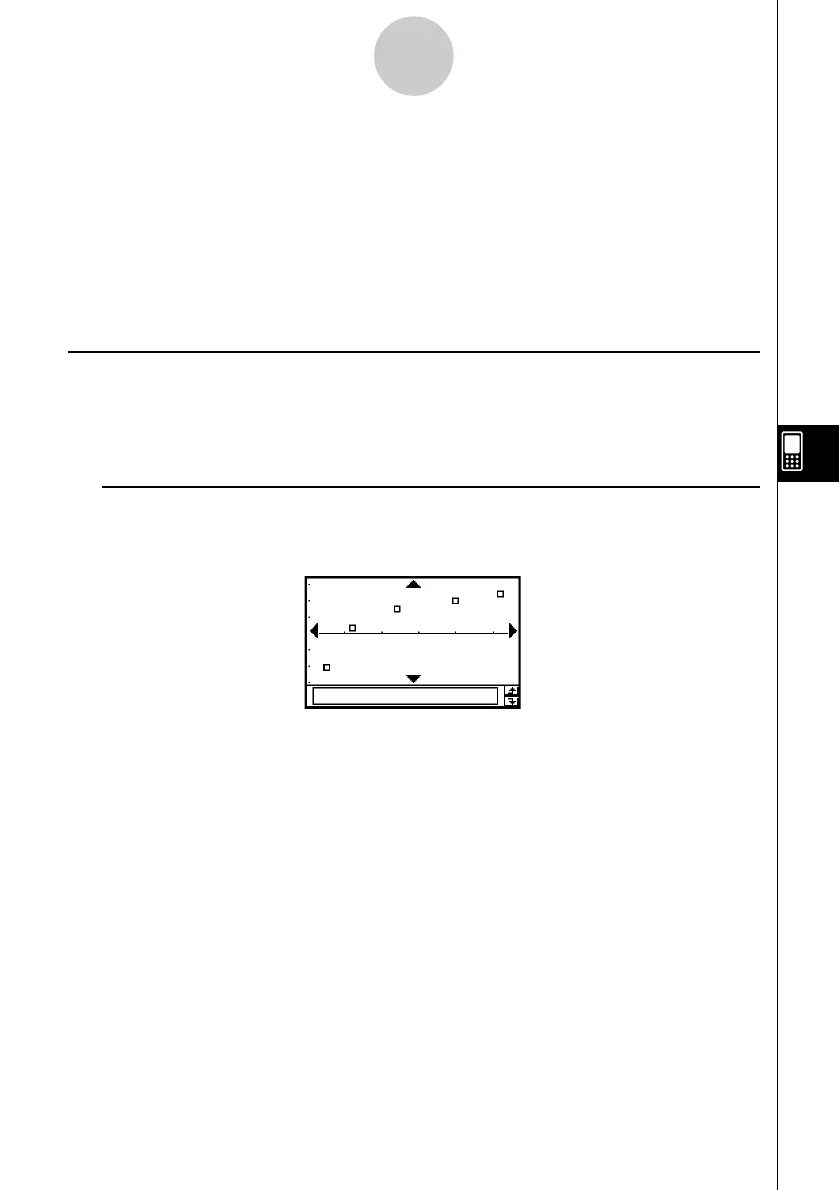
Normal Probability Plot (NPPlot)
The normal probability plot plots data against a theoretical normal distribution using a scatter
plot. If the scatter plot is close to a straight line, then the data is approximately normal. A
departure from the straight line indicates a departure from normality.
k Graph Parameter Settings (page 7-3-3, 7-3-4)
•[XList] specifies the list that contains the data to be plotted.
•[Mark] specifies the shape of the plot mark.
7-4-1
Graphing Single-Variable Statistical Data
20030201

 Loading...