20021201
4-3-1
Drawing a Conics Graph
4-3 Drawing a Conics Graph
This section provides examples that show how to draw various types of conics graphs.
Drawing a Parabola
A parabola can be drawn with either a horizontal or vertical orientation. The parabola type is
determined by the direction of its principal axis.
k Drawing a Parabola that Opens Horizontally
A parabola with a horizontal axis is one whose principal axis is parallel to the x-axis. There
are two possible equations for a parabola with a horizontal axis:
x = A(y – K)
2
+ H and x = Ay
2
+ By + C.
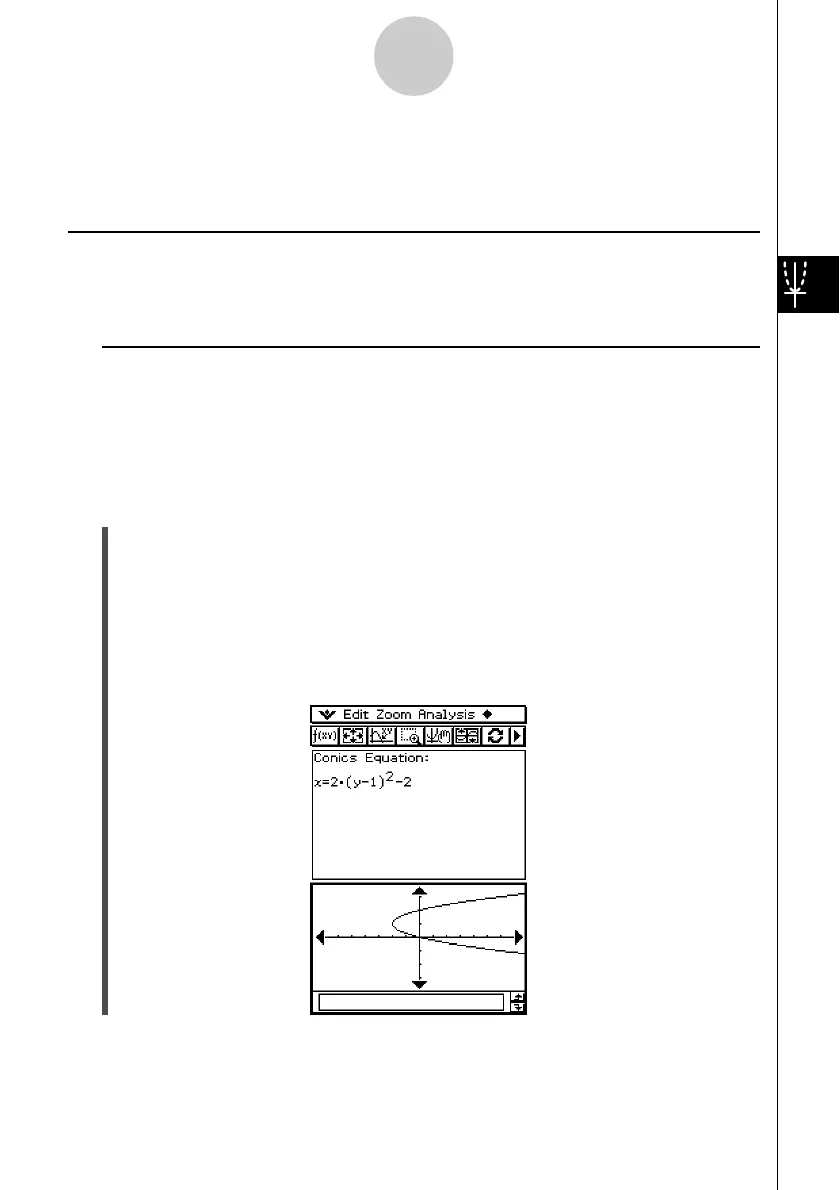
Example 1: To draw the parabola x = 2(y – 1)
2
– 2
u ClassPad Operation
(1) On the Conics Editor window, tap q, or tap [Form] and then [Insert Conics Form].
• This displays the Select Conics Form dialog box.
(2) Select “X = A(Y – K)
2
+ H” and then tap [OK].
• This closes the Select Conics Form dialog box, and displays the selected equation in
the Conics Editor window.
(3) Change the coefficients of the equation as follows: A = 2, K = 1, H = –2.
(4) Tap ^ to graph the equation.

 Loading...