20021201
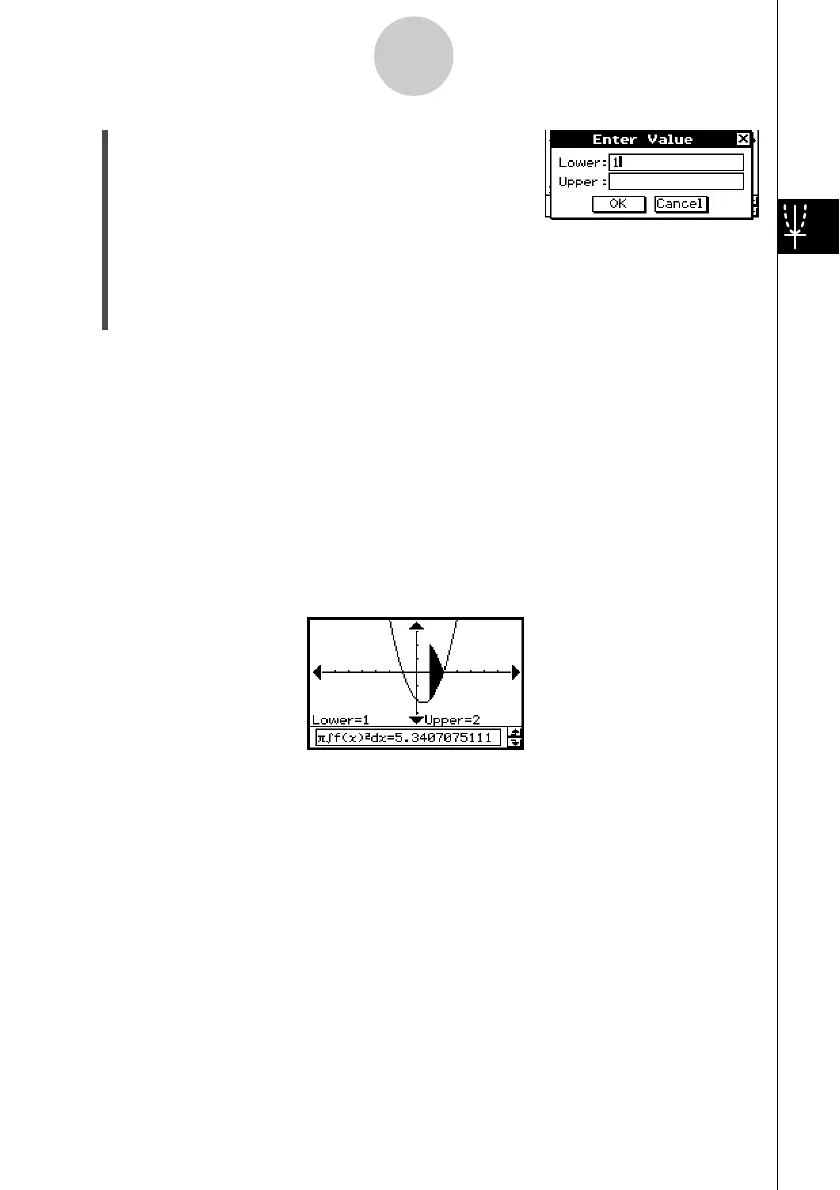
(4) Press 1.
• This displays a dialog box for inputting an interval of
values for x, with 1 specified for the lower limit of the
x-axis (Lower).
(5) Tap the [Upper] input box and then input 2 for the upper limit of the x-axis.
(6) Tap [OK].
• This causes a silhouette of the solid of revolution to appear on the Graph window, and
its volume to appear in the message box.
Tip
• Instead of inputting [Lower] and [Upper] values in steps (4) through (6), you can use the cursor
key or the graph controller arrows to move the pointer along the graph to specify the lower limit
and upper limit. If you do, perform the following two steps after step (3).
(4) Use the cursor key or the graph controller to move the pointer to the location of the lower limit
and then press E.
• This registers the lower limit and changes the word in the lower right corner of the Graph
window to “Upper”.
(5) Move the pointer to the location of the upper limit, and then press E.
Result Screenshot
3-8-9
Analyzing a Function Used to Draw a Graph

 Loading...