ε-32
Starting a Sampling Operation
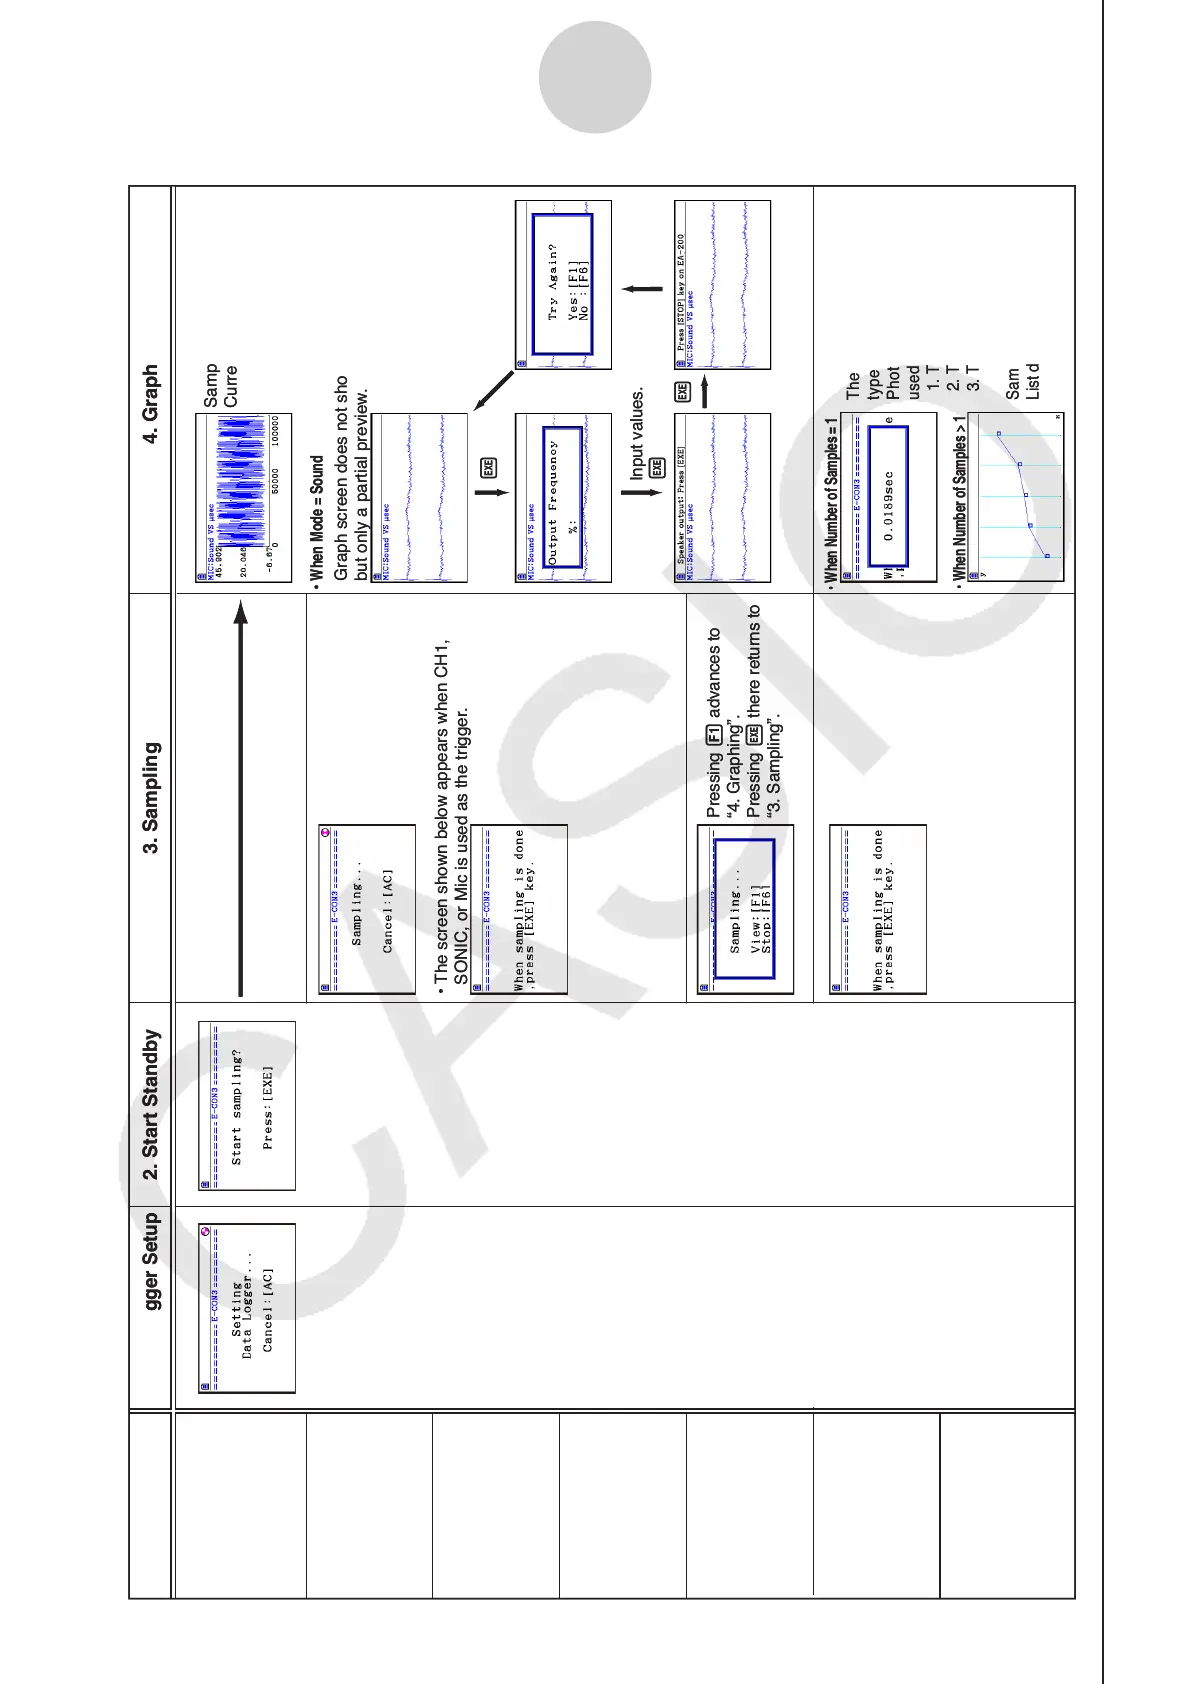
• The screen shown below appears when CH1,
SONIC, or Mic is used as the trigger.
Pressing 1 advances to
“4. Graphing”.
Pressing w there returns to
“3. Sampling”.
Sampled values are saved as
Current Sample Data.
Graph screen does not show all sampled values,
but only a partial preview.
•
When Mode = Sound
The following three graph
types can be produced when
Photogate-Pulley is being
used.
1.
Time and distance graph
2.
Time and velocity graph
3.
Time and acceleration graph
Sample values are stored as
List data only.
tarts Samplin
Starts Sampling
w1
w
• When Number of Samples = 1
•
When Number of Samples > 1
Input values.
w
Mode
Real-time
Fast
Normal
Sound
Extended
Period
Clock
1. Data Logger Setup
2. Start Standby 3. Sampling 4. Graphing
w

 Loading...


