Chapter 7: Statistics Application 134
Logistic regression (LogisticR) [Logistic Reg] ....................................................................
y =
c
1 + aⴢe
–bⴢx
Logistic regression is best for data whose values continually increase over time, until a saturation point is
reached.
Tip: Though ClassPad internally performs regression calculations after drawing a regression graph using the settings
of the Set StatGraphs dialog box (page 131), the calculation results (regression formula coefficients and other values)
cannot be displayed. To display regression calculation results, use the commands on the [Calc] - [Regression] menu,
which are shown in square brackets ([ ]) above.
Overlaying a Regression Graph on a Scatter Plot
You can use the Set StatGraphs dialog box (page 131) to plot a scatter plot* from paired-variable data and then
overlay a regression graph on it. This means you can visually determine which regression formula is closest to
the scatter plot.
* You can also overlay on other graph types as well.
u ClassPad Operation
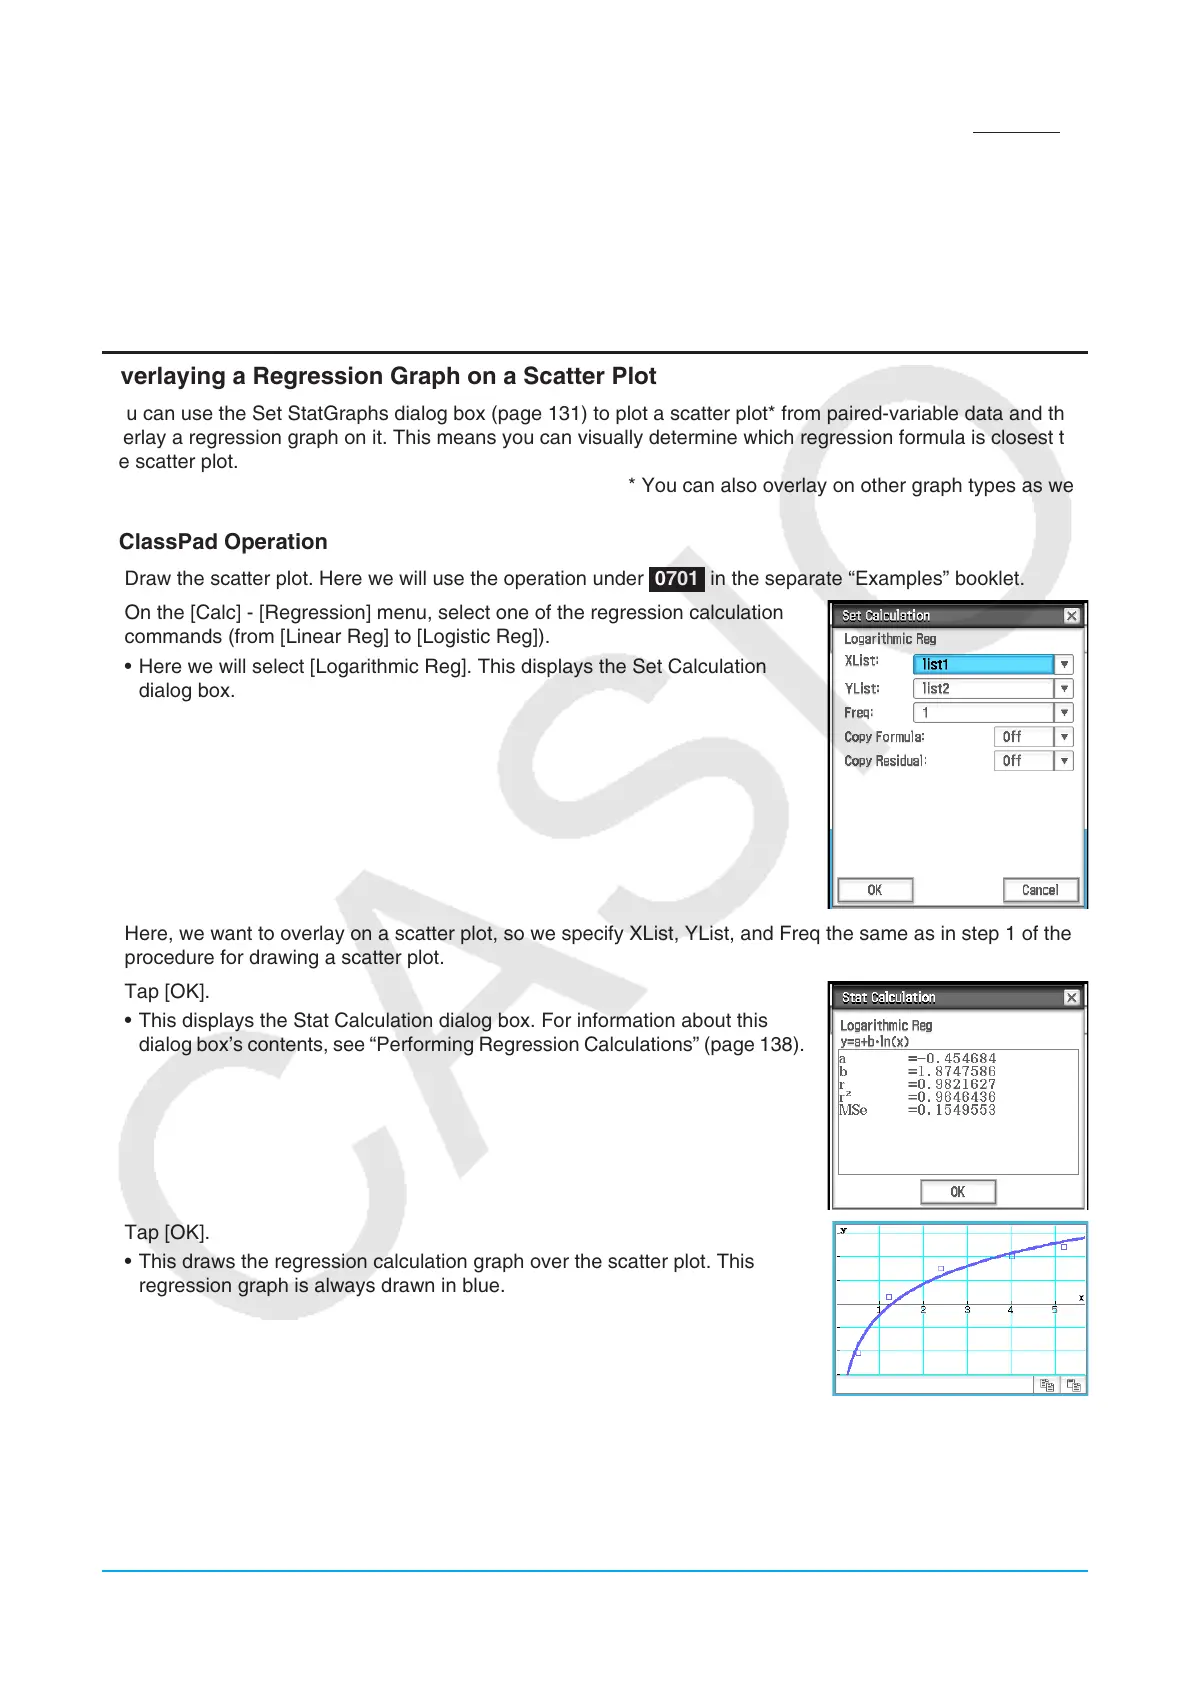
1. Draw the scatter plot. Here we will use the operation under 0701 in the separate “Examples” booklet.
2. On the [Calc] - [Regression] menu, select one of the regression calculation
commands (from [Linear Reg] to [Logistic Reg]).
• Here we will select [Logarithmic Reg]. This displays the Set Calculation
dialog box.
3. Here, we want to overlay on a scatter plot, so we specify XList, YList, and Freq the same as in step 1 of the
procedure for drawing a scatter plot.
4. Tap [OK].
• This displays the Stat Calculation dialog box. For information about this
dialog box’s contents, see “Performing Regression Calculations” (page 138).
5. Tap [OK].
• This draws the regression calculation graph over the scatter plot. This
regression graph is always drawn in blue.
• You can perform trace (page 109) on a regression graph. Trace scroll,
however, is not supported when a scatter plot is displayed.
Tip
• When performing Sinusoidal regression, make sure that “Radian” is selected for the [Angle] setting on the Basic Format
dialog box (page 34). The graph cannot be drawn correctly when the [Angle] setting is anything other than “Radian”.
• When performing Sinusoidal regression or Logistic regression, certain types of data may cause calculation to take a long
time. This is normal and does not indicate malfunction.

 Loading...


