Appendix 266
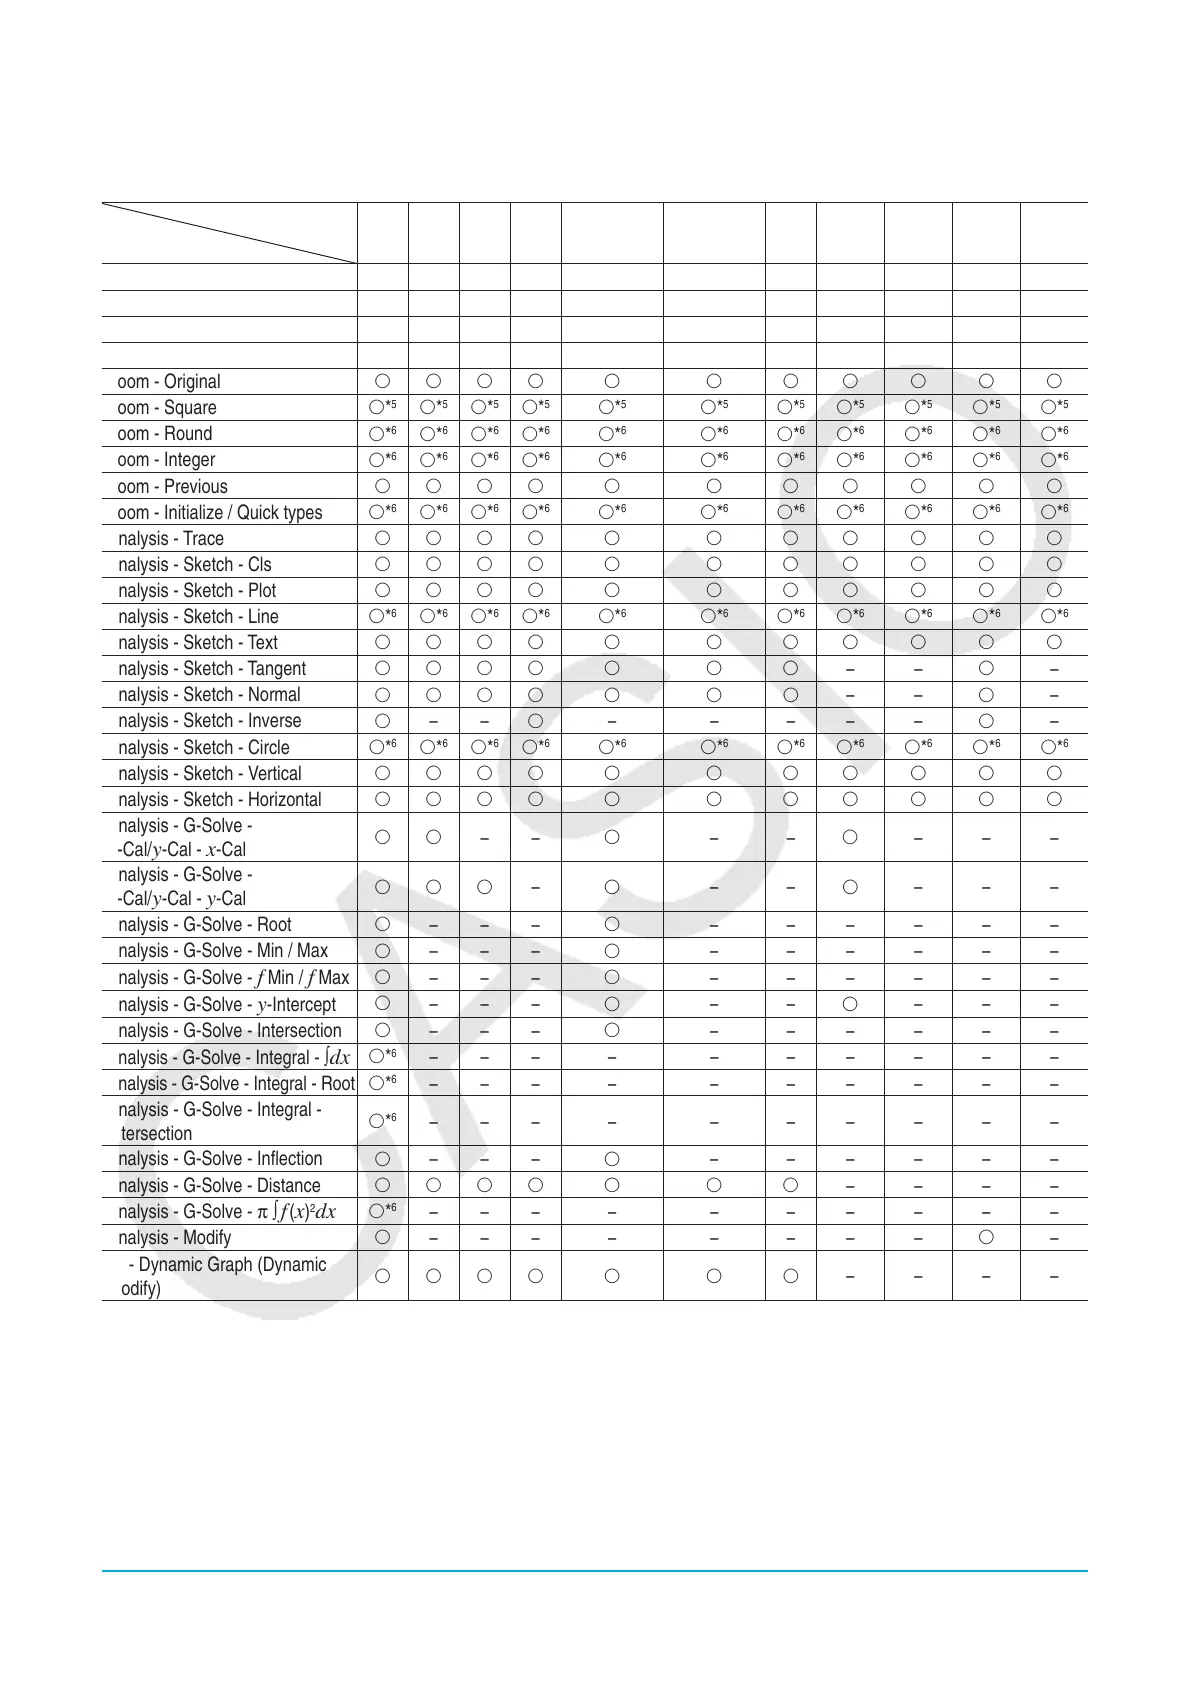
Graph Types and Executable Functions
䊊: Executable −: Not executable
Graph Type
Function
y= r= xt= x= y Inequality x Inequality y䉬
Conics*
1
Stat -
Plot*
2
Stat -
Reg*
3
Stat -
Box*
4
Zoom - Box
䊊䊊䊊䊊 䊊 䊊 䊊 䊊 䊊 䊊 䊊
Zoom - In
䊊䊊䊊䊊 䊊 䊊 䊊 䊊 䊊 䊊 䊊
Zoom - Out
䊊䊊䊊䊊 䊊 䊊 䊊 䊊 䊊 䊊 䊊
Zoom - Auto
䊊䊊䊊䊊 䊊 䊊 䊊 䊊
−−−
Zoom - Original
䊊䊊䊊䊊 䊊 䊊 䊊 䊊 䊊 䊊 䊊
Zoom - Square
䊊*
5
䊊*
5
䊊*
5
䊊*
5
䊊*
5
䊊*
5
䊊*
5
䊊*
5
䊊*
5
䊊*
5
䊊*
5
Zoom - Round
䊊*
6
䊊*
6
䊊*
6
䊊*
6
䊊*
6
䊊*
6
䊊*
6
䊊*
6
䊊*
6
䊊*
6
䊊*
6
Zoom - Integer
䊊*
6
䊊*
6
䊊*
6
䊊*
6
䊊*
6
䊊*
6
䊊*
6
䊊*
6
䊊*
6
䊊*
6
䊊*
6
Zoom - Previous
䊊䊊䊊䊊 䊊 䊊 䊊 䊊 䊊 䊊 䊊
Zoom - Initialize / Quick types
䊊*
6
䊊*
6
䊊*
6
䊊*
6
䊊*
6
䊊*
6
䊊*
6
䊊*
6
䊊*
6
䊊*
6
䊊*
6
Analysis - Trace
䊊䊊䊊䊊 䊊 䊊 䊊 䊊 䊊 䊊 䊊
Analysis - Sketch - Cls
䊊䊊䊊䊊 䊊 䊊 䊊 䊊 䊊 䊊 䊊
Analysis - Sketch - Plot
䊊䊊䊊䊊 䊊 䊊 䊊 䊊 䊊 䊊 䊊
Analysis - Sketch - Line
䊊*
6
䊊*
6
䊊*
6
䊊*
6
䊊*
6
䊊*
6
䊊*
6
䊊*
6
䊊*
6
䊊*
6
䊊*
6
Analysis - Sketch - Text
䊊䊊䊊䊊 䊊 䊊 䊊 䊊 䊊 䊊 䊊
Analysis - Sketch - Tangent
䊊䊊䊊䊊 䊊 䊊 䊊
−−
䊊
−
Analysis - Sketch - Normal
䊊䊊䊊䊊 䊊 䊊 䊊
−−
䊊
−
Analysis - Sketch - Inverse
䊊
−−
䊊
−−−−−
䊊
−
Analysis - Sketch - Circle
䊊*
6
䊊*
6
䊊*
6
䊊*
6
䊊*
6
䊊*
6
䊊*
6
䊊*
6
䊊*
6
䊊*
6
䊊*
6
Analysis - Sketch - Vertical
䊊䊊䊊䊊 䊊 䊊 䊊 䊊 䊊 䊊 䊊
Analysis - Sketch - Horizontal
䊊䊊䊊䊊 䊊 䊊 䊊 䊊 䊊 䊊 䊊
Analysis - G-Solve -
x-Cal/y-Cal - x-Cal
䊊䊊
−−
䊊
−−
䊊
−−−
Analysis - G-Solve -
x-Cal/y-Cal - y-Cal
䊊䊊䊊
−
䊊
−−
䊊
−−−
Analysis - G-Solve - Root
䊊
−−−
䊊
− −−−−−
Analysis - G-Solve - Min / Max
䊊
−−−
䊊
− −−−−−
Analysis - G-Solve -
f Min / f Max
䊊
−−−
䊊
− −−−−−
Analysis - G-Solve -
y-Intercept
䊊
−−−
䊊
−−
䊊
−−−
Analysis - G-Solve - Intersection
䊊
−−−
䊊
− −−−−−
Analysis - G-Solve - Integral - ∫dx
䊊*
6
−−− − − − − − − −
Analysis - G-Solve - Integral - Root
䊊*
6
−−− − − − − − − −
Analysis - G-Solve - Integral -
Intersection
䊊*
6
−−− − − − − − − −
Analysis - G-Solve - Inflection
䊊
−−−
䊊
− −−−−−
Analysis - G-Solve - Distance
䊊䊊䊊䊊 䊊 䊊 䊊
−−−−
Analysis - G-Solve - π ∫
f (x)
2
dx
䊊*
6
−−− − − − − − − −
Analysis - Modify
䊊
−−− − − − − −
䊊
−
䉬 - Dynamic Graph (Dynamic
Modify)
䊊䊊䊊䊊 䊊 䊊 䊊
−−−−
*1 The special conics graph G-Solve commands below can be used when drawing a conics graph.
Focus, Vertex, Directrix, Symmetry, Latus Rectum Length, Center, Radius, Asymptotes, Eccentricity,
x-Intercept
*2 The following statistical graphs: Scatter, Histogram,
xyLine, Broken, NPPlot
*3 The following statistical graphs: NDist, LinearR, MedMed, QuadR, CubicR, QuartR, LogR, ExpR, abExpR, PowerR, SinR, LogisticR
*4 The following statistical graphs: MedBox, ModBox
*5 Cannot be executed during semi-log graph drawing (when a graph is drawn while either the
x-log or y-log check box only is selected
on the View Window dialog box).
*6 Cannot be executed during semi-log graph or log-log grapy drawing (when a graph is drawn while either the
x-log or y-log check box
is selected or when both check boxes are selected on the View Window dialog box).

 Loading...


