Chapter 13: Spreadsheet Application 236
Other Graph Window Operations
This section provides more details about the types of operations you can perform while the Graph window is on
the display.
u To change the appearance of a graph by dragging a point
While a graph is on the Graph window, use the stylus to drag any one of its data points to change the
configuration of the graph.
• You can change curves, make bars or columns longer or shorter, or change the size of pie graph sections.
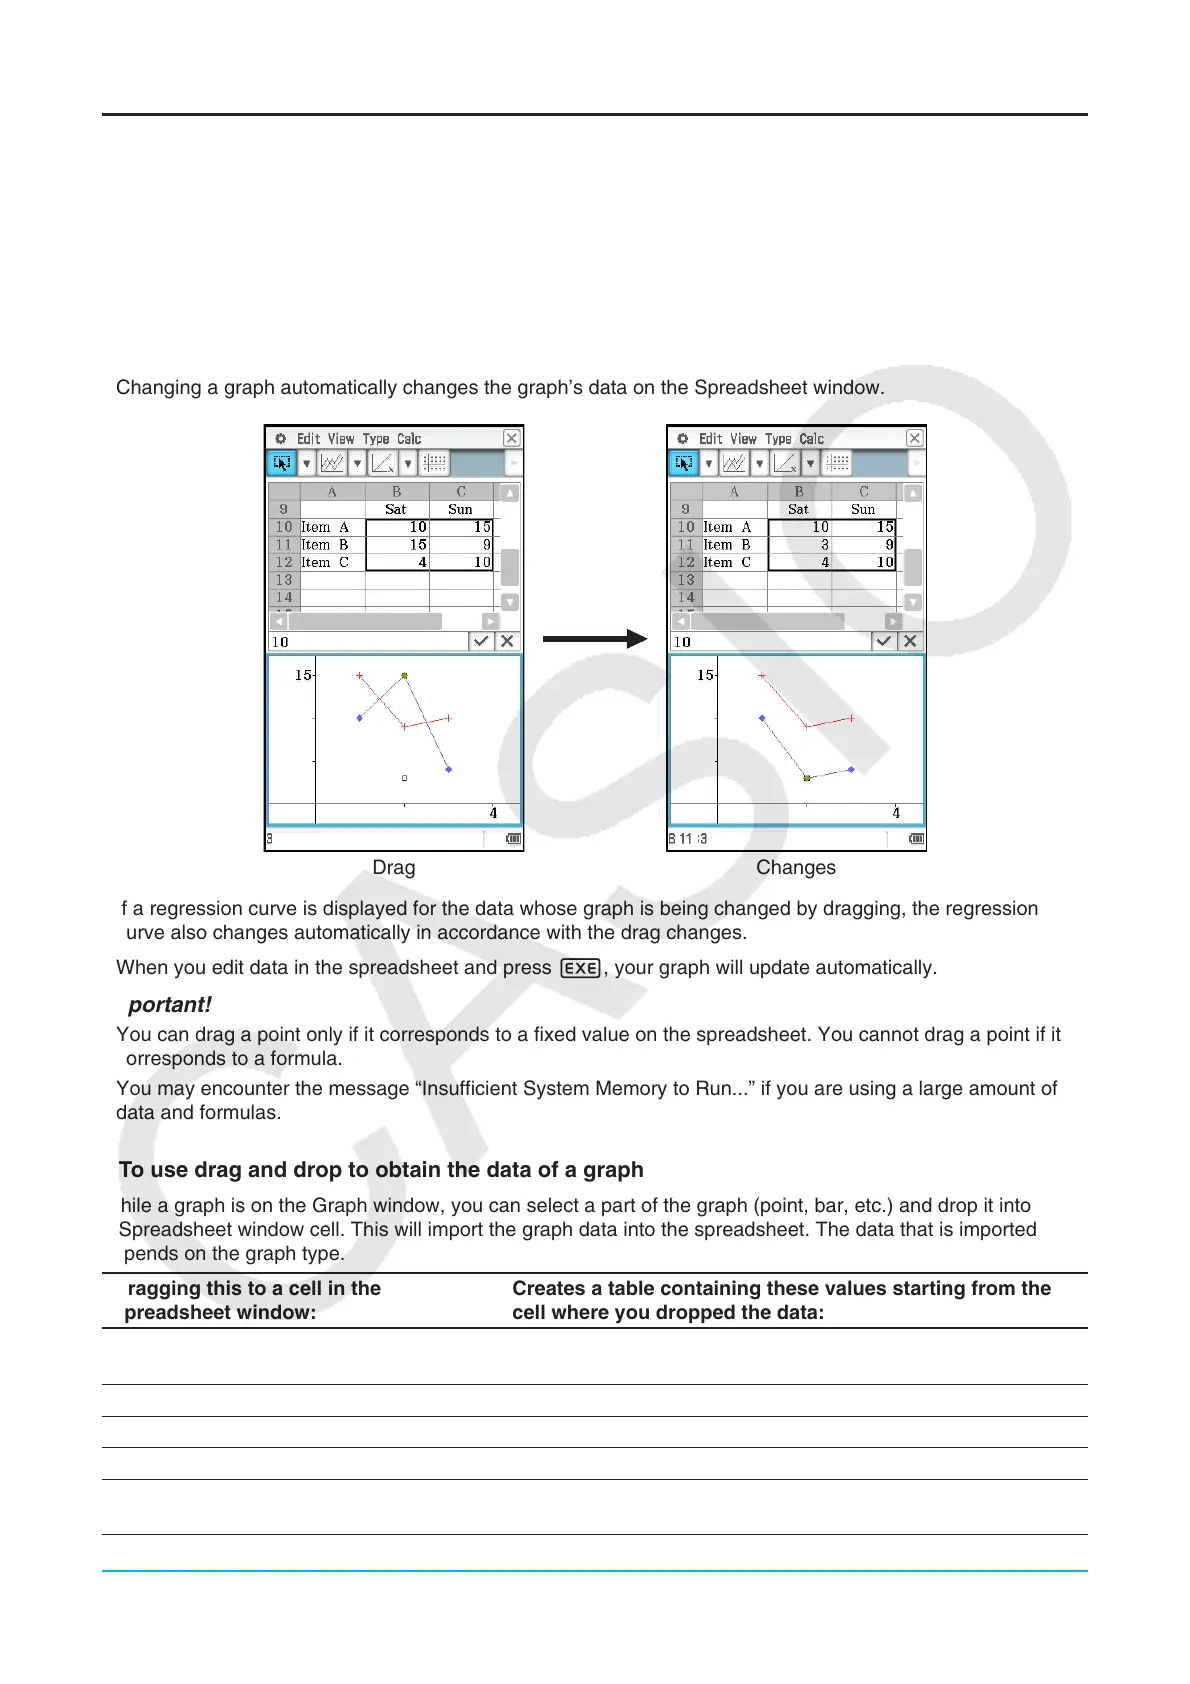
• Changing a graph automatically changes the graph’s data on the Spreadsheet window.
Drag Changes
• If a regression curve is displayed for the data whose graph is being changed by dragging, the regression
curve also changes automatically in accordance with the drag changes.
• When you edit data in the spreadsheet and press E, your graph will update automatically.
Important!
• You can drag a point only if it corresponds to a fixed value on the spreadsheet. You cannot drag a point if it
corresponds to a formula.
• You may encounter the message “Insufficient System Memory to Run...” if you are using a large amount of
data and formulas.
u To use drag and drop to obtain the data of a graph
While a graph is on the Graph window, you can select a part of the graph (point, bar, etc.) and drop it into
a Spreadsheet window cell. This will import the graph data into the spreadsheet. The data that is imported
depends on the graph type.
Dragging this to a cell in the
spreadsheet window:
Creates a table containing these values starting from the
cell where you dropped the data:
A point of a line graph, a column of a
column graph, or a bar of a bar graph
All of the values in the series associated with the point, column,
or bar
A point of a scatter graph
All (
x, y) values of the series associated with the point
A pieces of a pie graph A percentage value relative to the entire pie graph
Any of the bins of a histogram graph The values of the histogram graph
Any of the Q
1
, Q
3
, Med, Min, or Max
location of a box whisker graph
The graph’s values (Min, Q
1
, Median, Q
3
, Max)

 Loading...


