Working with Application Graphs Applications
Agilent 8163A/B, 8164A/B & 8166A/B Mainframes, Sixth Edition 231
Working with Application
Graphs
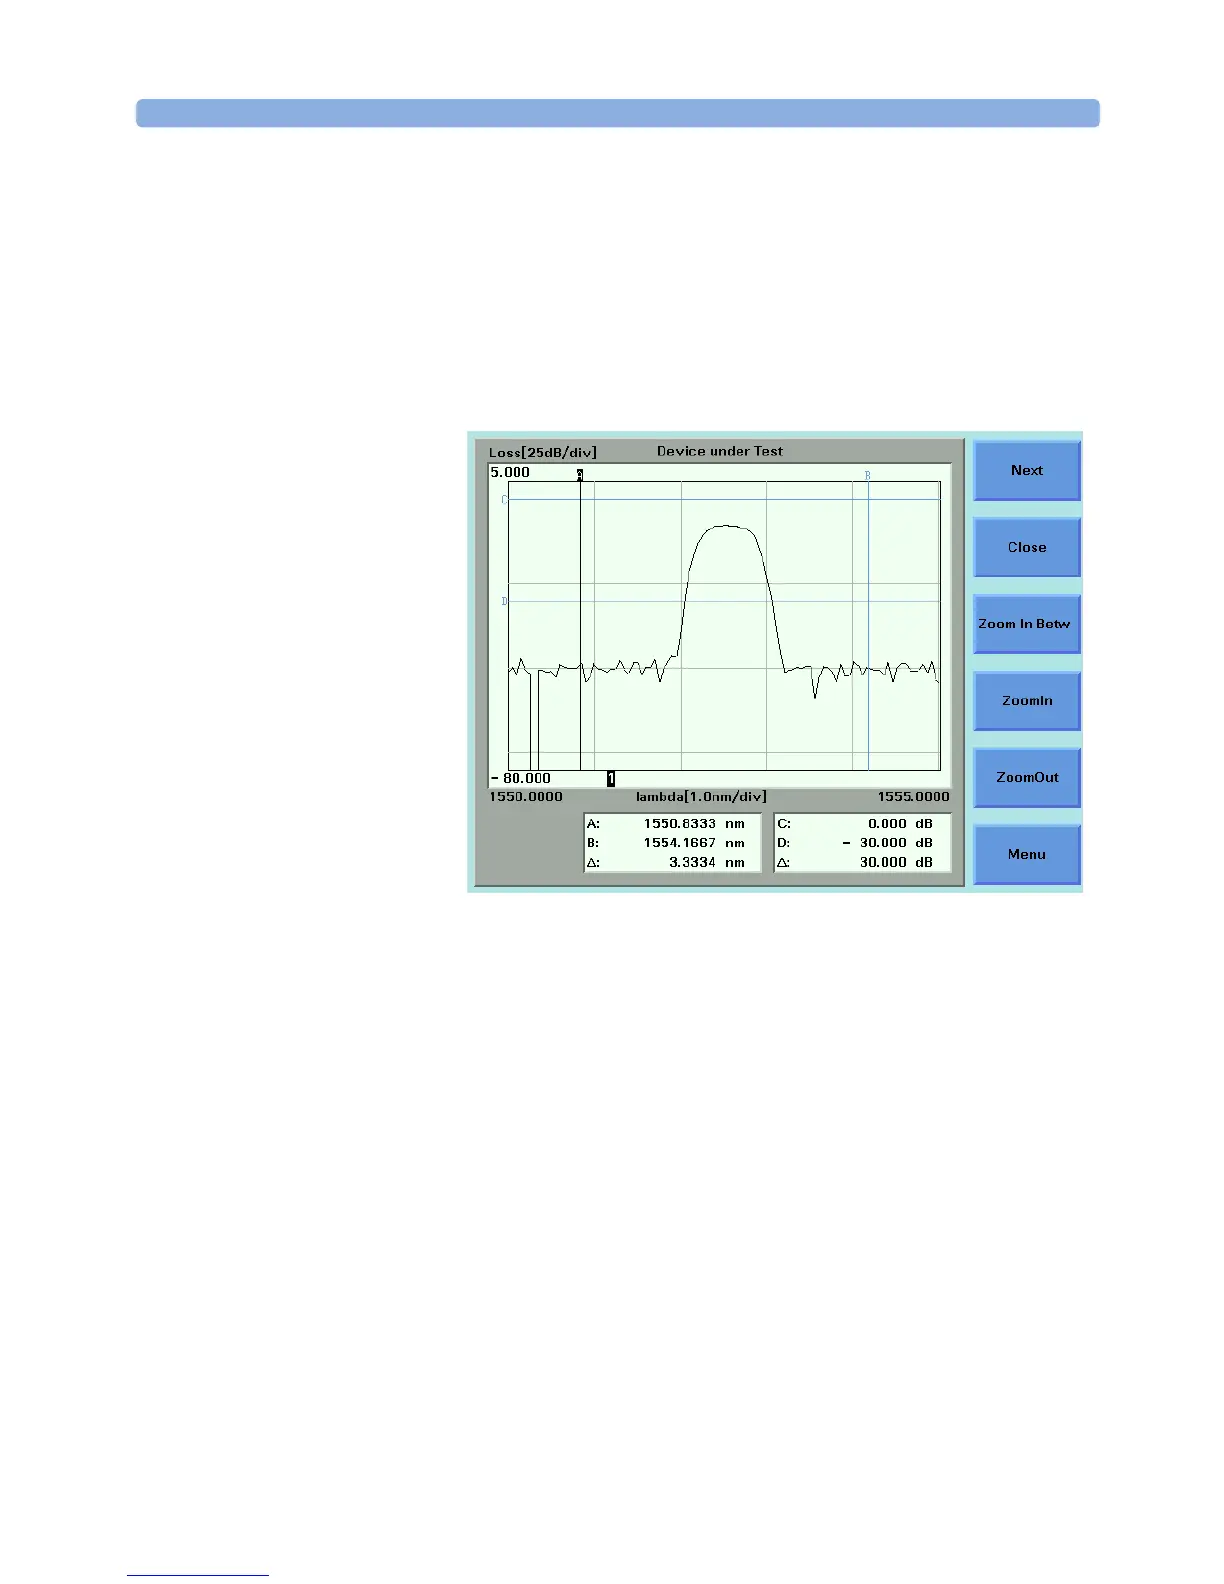
If you press the [Graph] softkey, a graph similar to Figure 137 appears.
This section explains how to use the graph.
Figure 137 The Application Graph
There are four markers A, B, C, and D. You can use these markers to
choose the area of the graph that you wish to zoom into.
For the Logging and Stability applications, the time values of A and B are
displayed at the bottom of the screen in units of seconds. The symbol ∆
that is listed directly beneath these values, displays the difference
between A and B in seconds.
For the PACT application, the wavelength values of A and B are displayed
at the bottom of the screen in units of nanometers (nm). The symbol ∆ that
is listed directly beneath these values, displays the difference between A
and B in nanometers (nm).
The power values of C and D are displayed at the bottom of the screen in
the chosen power units. The symbol ∆ that is listed directly beneath these
values, displays the difference between C and D in the chosen power units.
 Loading...