Applications The PACT Application
276 Agilent 8163A/B, 8164A/B & 8166A/B Mainframes, Sixth Edition
Analysing a PACT Measurement
You can access the PACT Analysis screen after the PACT Measurement
completes, by completing the following instructions:
28You cannot access the PACT Analysis screen from the graph. If you are viewing
the graph, press [Close].
29Press [Setup]. The Logging Analysis screen appears as shown in Figure 152 .
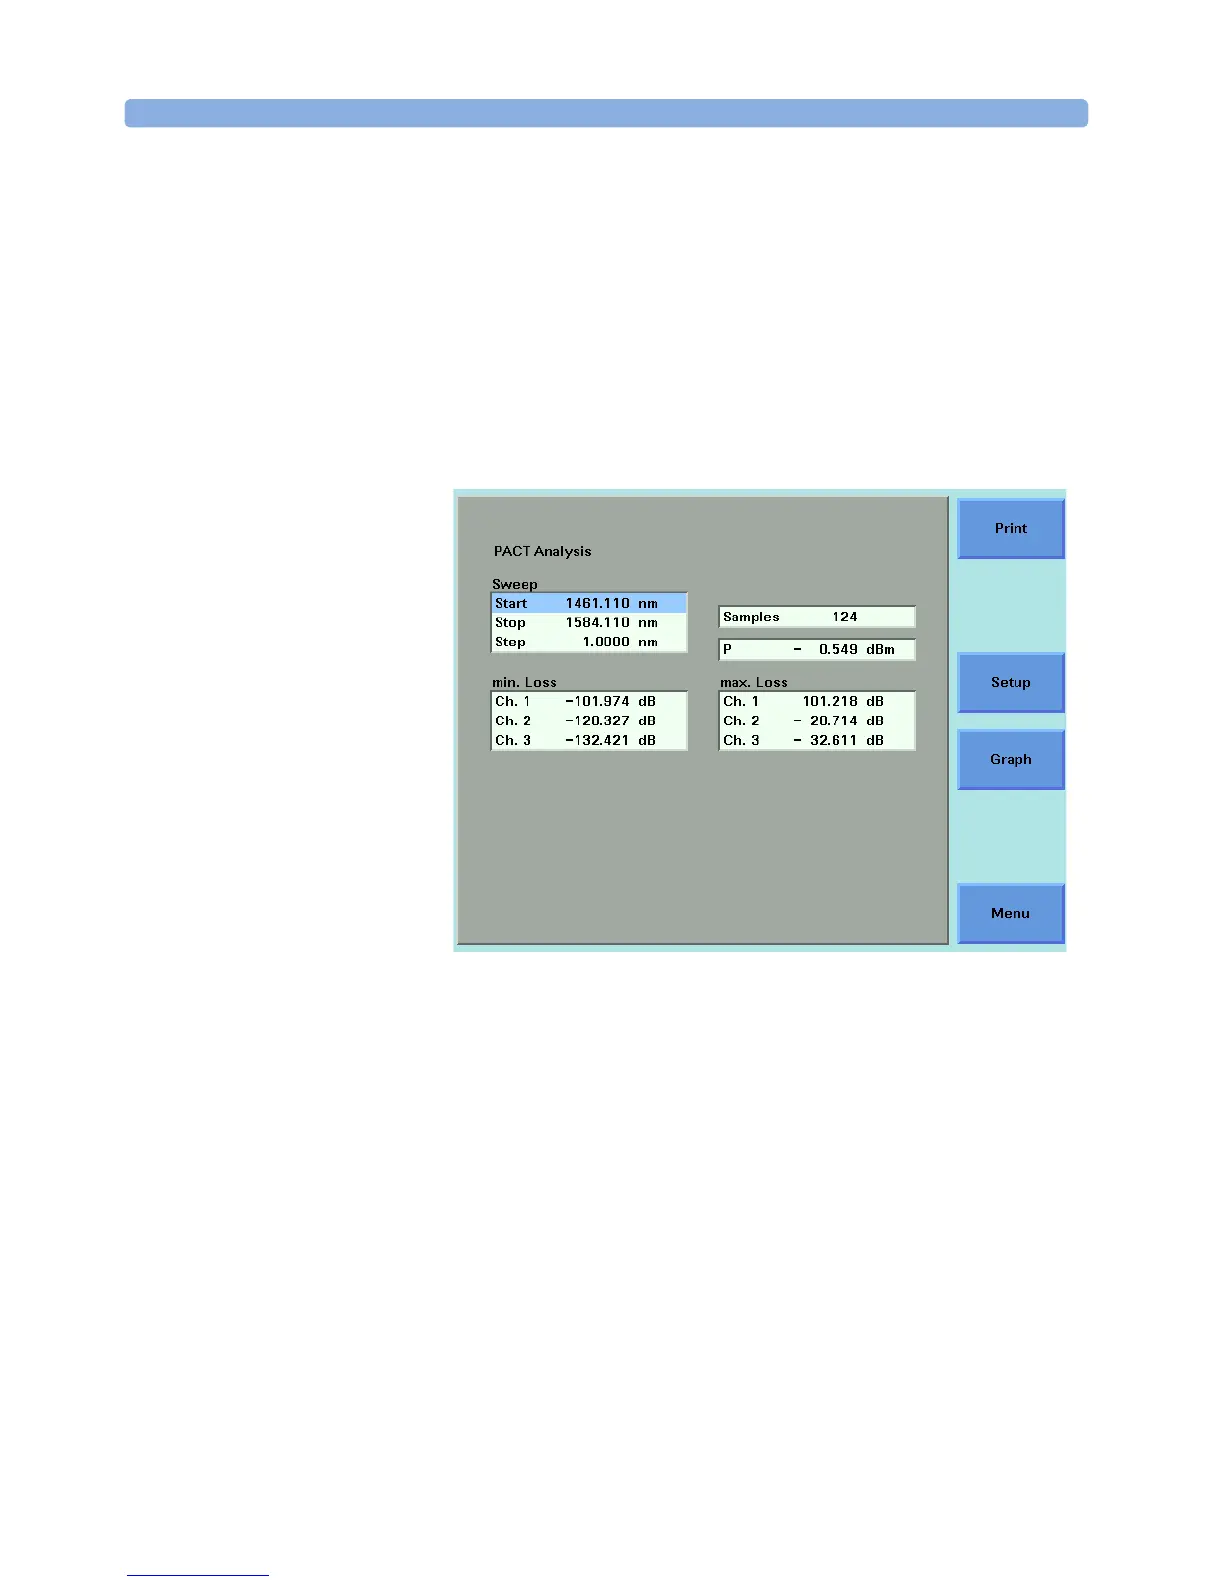
Figure 172 The PACT Analysis Screen
The sweep parameters are shown.
The following results of the PACT Measurement are shown for each
selected Power Meter channel:
• min. Loss, the minimum loss value for the particular Power Meter channel for
the sweep, and
• max. Loss, the maximum loss value for the particular Power Meter channel for
the sweep.
 Loading...