Integrated Network Analyzer
Using the Analyzer
23
Note
The 10/100/1000 port and 1000BASE-X fiber port on the top of the
analyzer also show link and utilization.
The 10/100/1000 port's left LED shows link as: 10Mb = green,
100Mb = blue, 1000Mb = white
The 10/100/1000 and Fiber port's right LED shows utilization as:
10 - 50% utilization = green, 60 - 80% utilization = yellow,
90 - 100% utilization = red
The Fiber port's left LED is always white indicating 1000Mb.
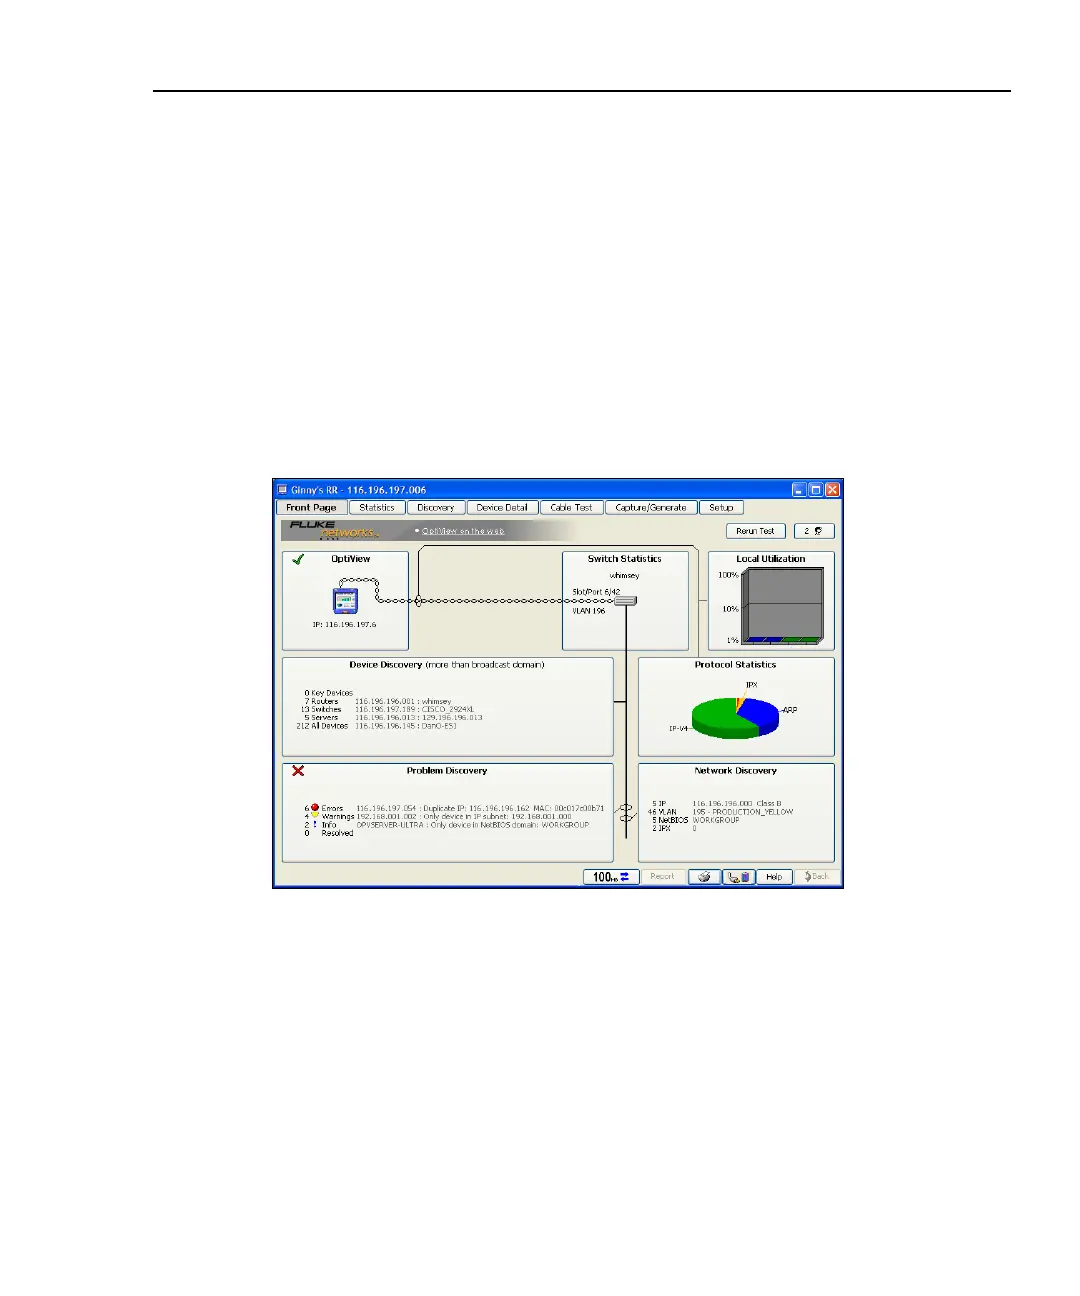
Front Page Screen
aww50s.bmp
Figure 14. Front Page Screen
The Front Page screen is an overview and launching point to monitor and test your
network. This screen presents the closest switch (Switch Statistics button), any
network problems (Problem Discovery button), all discovered devices (Device
Discovery button), Network Discovery, and statistics (Protocol Statistics and
Local Utilization buttons). The health (e.g. state, condition, etc.) of your network
is discovered and problems are displayed if they exist.
Rerun Test allows you to clear all statistics and discovery information, and restart
all network device discovery.
 Loading...