EasyManuals Logo
Home>Keithley>Measuring Instruments>Series 2600

Keithley Series 2600 User Manual

Keithley Series 2600
136 pages
To Next Page IconTo Next Page
To Previous Page IconTo Previous Page
Page #34 background imageLoading...
Page #34 background image
4-5
SECTION 4
FET Tests
Once the measurements have completed, the data (V11.
GS
, V
DS
, I
D
,
and g
fs
) will be presented in the Instrument Console window
of TSB.
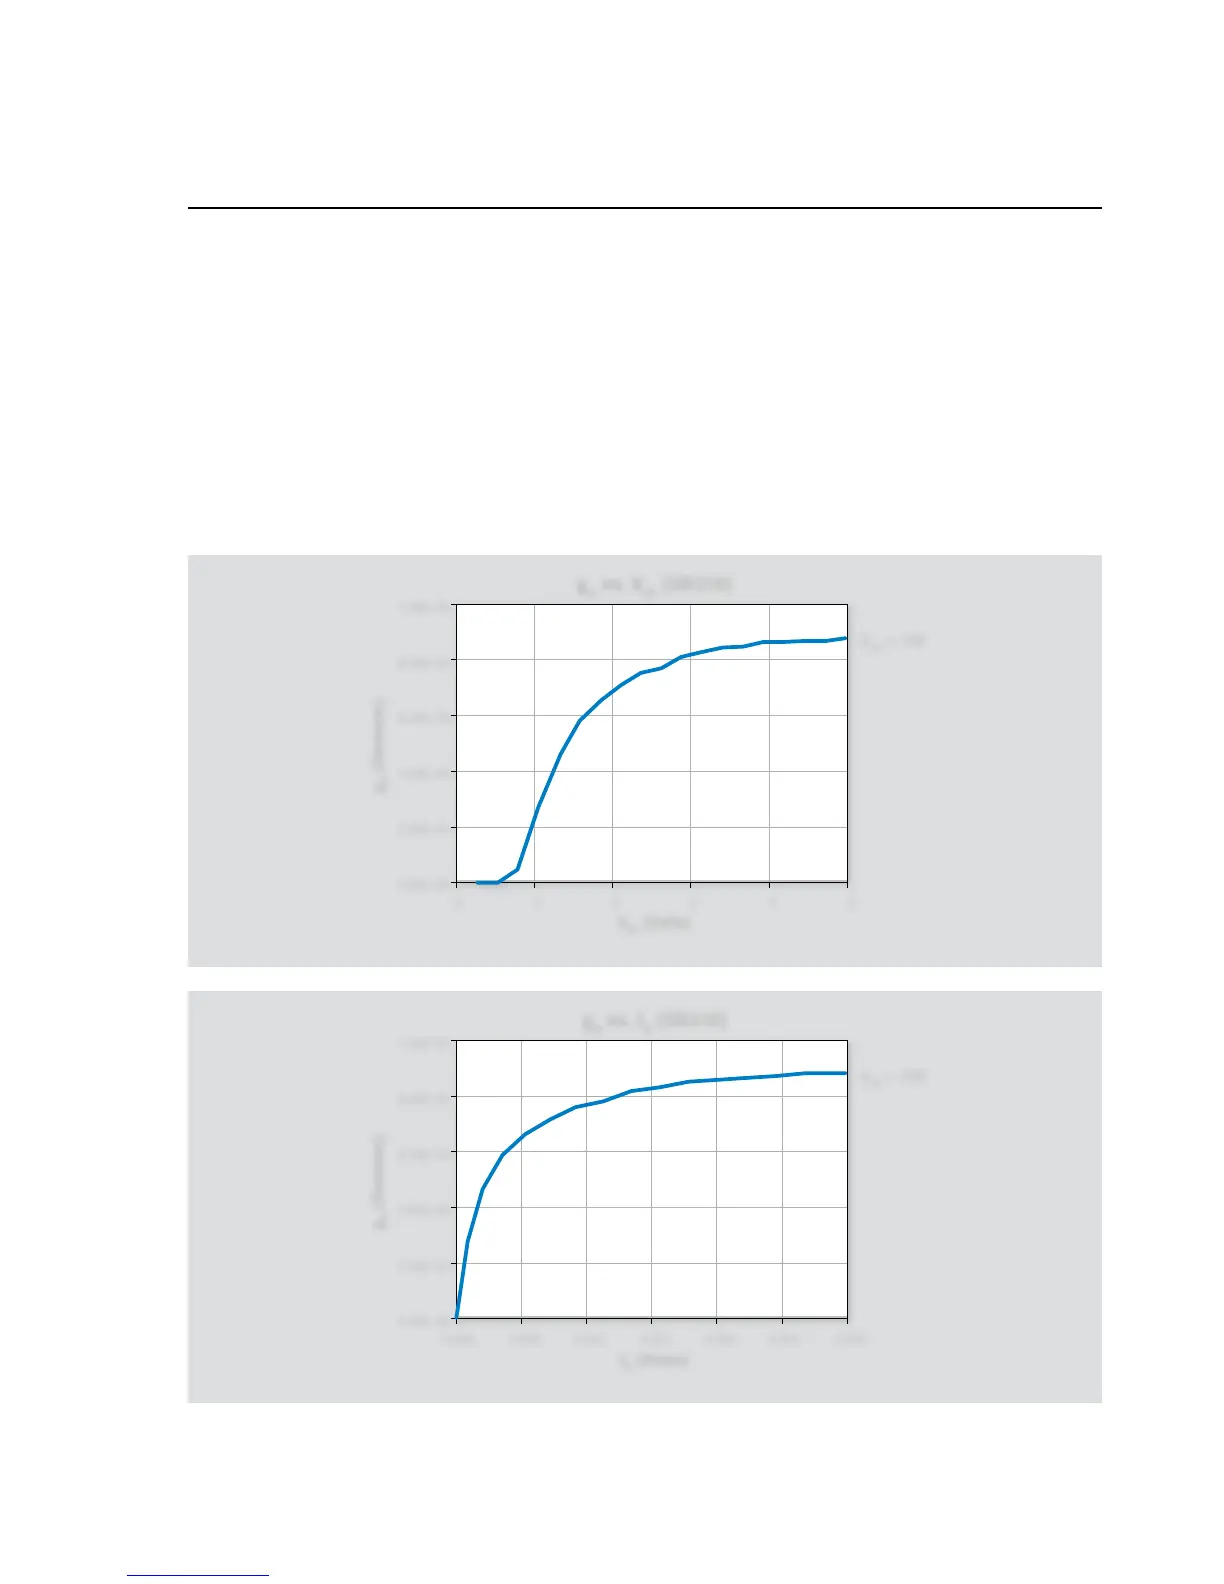
4.4.3 Typical Program 10 Results
Figure 4-4 shows a typical g
fs
vs. V
GS
plot as generated by the
example program. Again, an SD210 N-channel FET was used for
the example plot.
Figure 4-5 shows a typical g
fs
vs. I
D
plot generated by the example
program.
4.4.4 Program 10 Description
The instrument is returned to default conditions. SMUB, which
sweeps V
GS
, is programmed as follows:
Source V•
1mA compliance, autorange•
Local sense•
vgsstart
• : 0V
vgsstop
• : 5V
vgssteps
• : 100
g
fs
vs. V
GS
(SD210)
V
GS
(Volts)
V
DS
= 10V
g
fs
(Siemens)
1.00E–02
8.00E–03
6.00E–03
4.00E–03
2.00E–03
0.00E–00
0 1 2 3 4 5
Figure 4-4. Program 10 results: Transconductance vs. V
GS
g
fs
vs. I
D
(SD210)
I
D
(Amps)
V
DS
= 10V
g
fs
(Siemens)
1.00E–02
8.00E–03
6.00E–03
4.00E–03
2.00E–03
0.00E–00
0.000 0.005 0.010 0.015 0.020 0.025 0.030
Figure 4-5. Program 10 results: Transconductance vs. I
D

Table of Contents

Questions and Answers:

Question and Answer IconNeed help?

Do you have a question about the Keithley Series 2600 and is the answer not in the manual?

Keithley Series 2600 Specifications

General IconGeneral
BrandKeithley
ModelSeries 2600
CategoryMeasuring Instruments
LanguageEnglish

Related product manuals