3-3
SECTION 3
Bipolar Transistor Tests
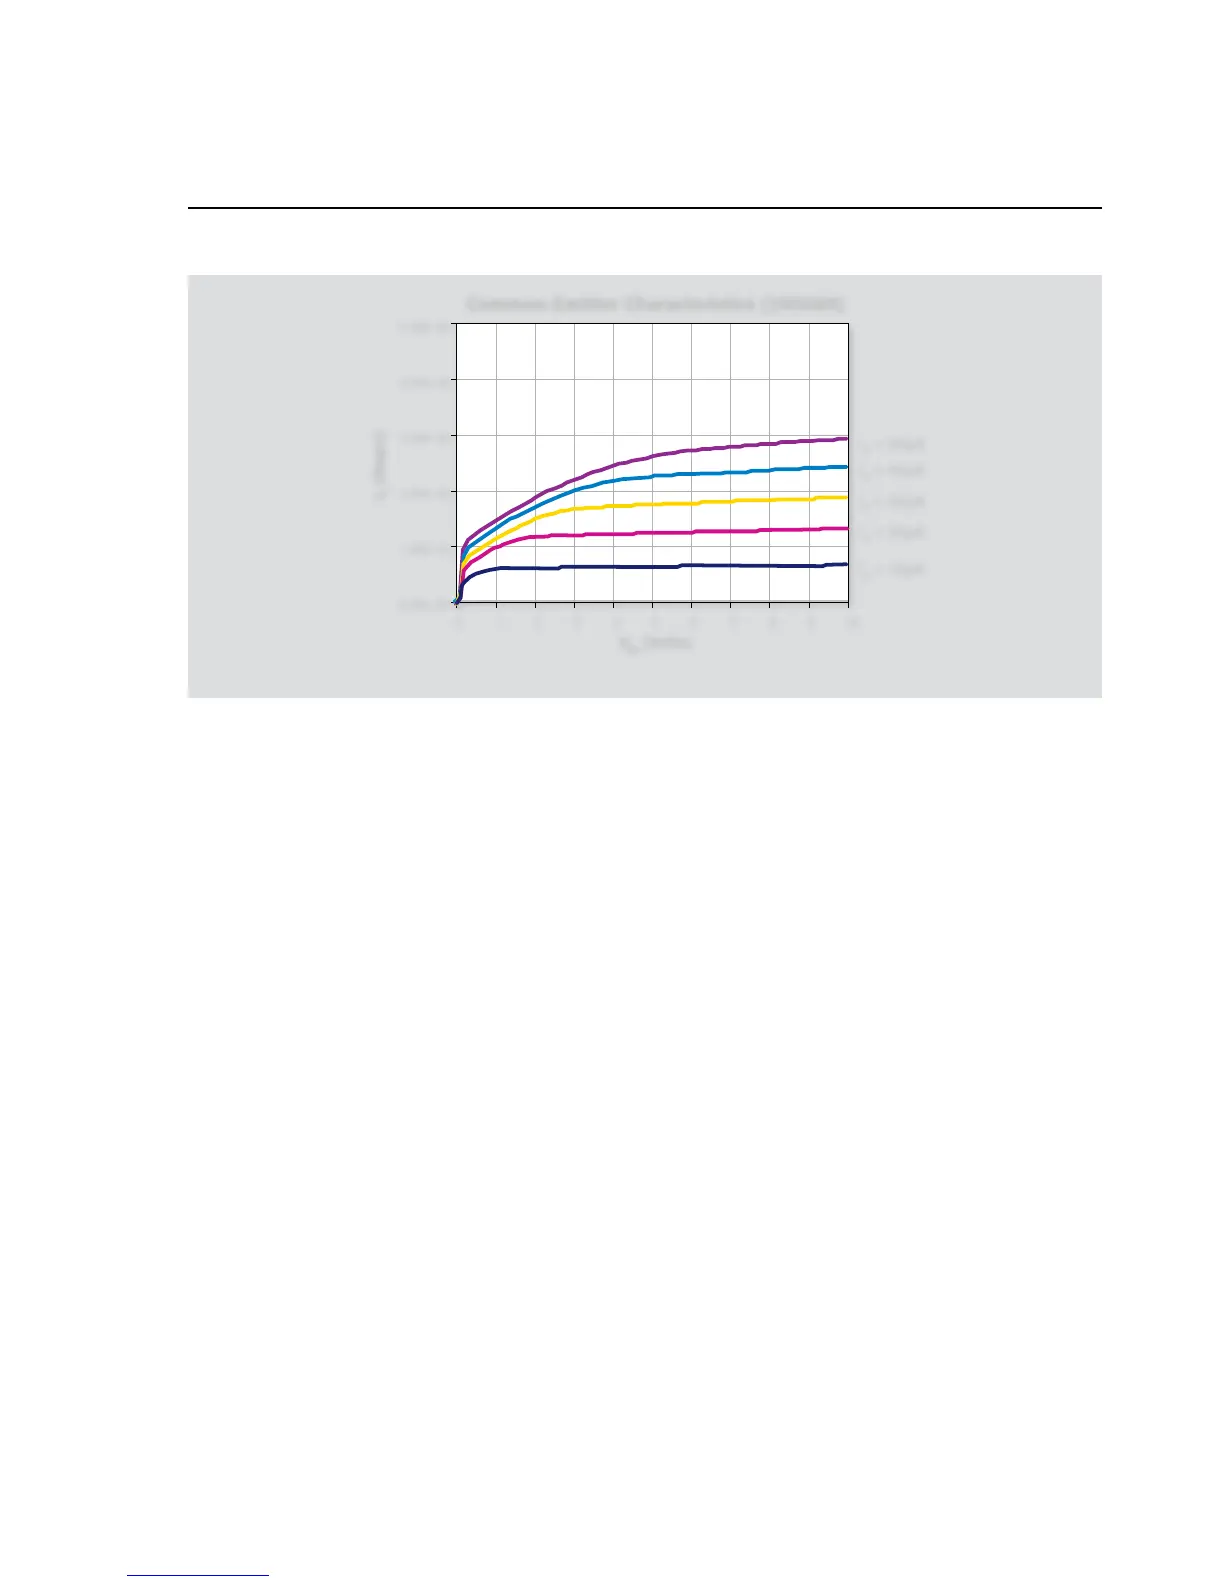
3.3.4 Typical Program 4 Results
Figure 3-2 shows typical results generated by Example Program 4.
A 2N5089 NPN transistor was used to generate these test results.
3.3.5 Program 4 Description
For the following program description, refer to the program
listing below.
Source I•
IV compliance, 1.1V range•
Local sense•
istart
• current: 10M
istop
• current: 50µA
isteps
• : 5
Following SMUB setup, SMUA, which sweeps VCE and measures
IC, is programmed as follows:
Source V•
Local sensing•
100mA compliance, autorange measure•
1 NPLC Line cycle integration (to reduce noise)•
vstart
• : 0V
vstop
• : 10V
vsteps
• : 100
Once the two units are configured, the SMUB sources
istart
,
SMUA sources
vstart
, and the voltage (V
CE
) and current (I
CE
)
for SMUA are measured. The source value for SMUA is then
incremented by
l _ vstep
, and the sweep is continued until
the source value reaches
vstop
. Then, SMUB is incremented by
l_istep
and SMUA begins another sweep from
vstart
to
vstop
in
vsteps
. This nested sweeping process continues until
SMUB reaches
istop
.
The instrument output is then turned off and the function
Print _ Data()
is run to print the data to the TSB window. To
graph the results, simply copy and paste the data into a spread-
sheet such as Microsoft Excel and chart.
3.4 Gummel Plot
A Gummel plot is often used to determine current gain variations
of a transistor. Data for a Gummel plot is obtained by sweeping
the base-emitter voltage (V
BE
) across the desired range of values at
specific increments. At each V
BE
value, both the base current (I
B
)
and collector current (I
C
) are measured.
Once the data are taken, the data for I
B
, I
C
, and V
BE
is returned to
the screen. If using TSB, a plot can be generated using the “copy-
and-paste” method in a spreadsheet program such as Microsoft
Excel. Because of the large differences in magnitude between I
B
and I
C
, the Y axis is usually plotted logarithmically.
3.4.1 Test Configuration
Figure 3-3 shows the test configuration for Gummel plot tests.
SMUB is used to sweep V
BE
across the desired range, and it also