90
figure 8-5 App Function Tree Map
8.7 Home
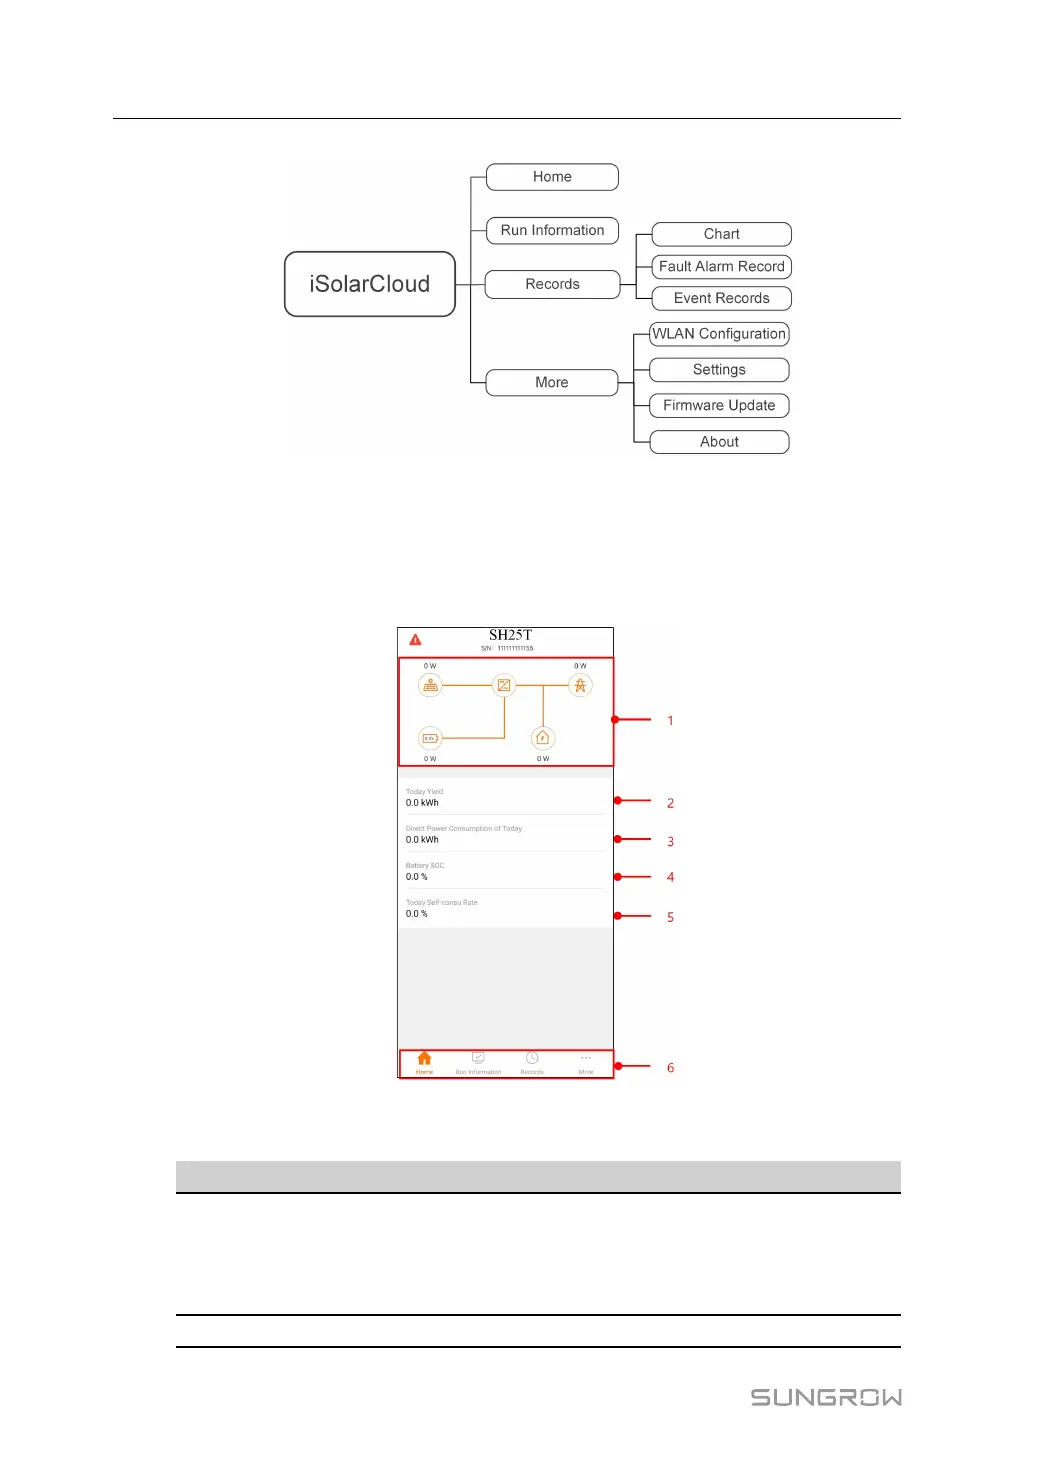
Home page of the App is shown in the following figure.
figure 8-6 Home
table 8-4 Home page description
No. Name
Description
1 Load flow chart
Shows the PV power generation power, feed-in
power, etc. The line with an arrow indicates energy
flow between connected devices, and the arrow
pointing indicates energy flow direction.
2
Today yield
Shows today power generation of the inverter
8 iSolarCloud App User Manual
 Loading...