92
figure 8-8 Records
On Records screen, users can view chart and check fault alarm record.
8.9.1 Chart
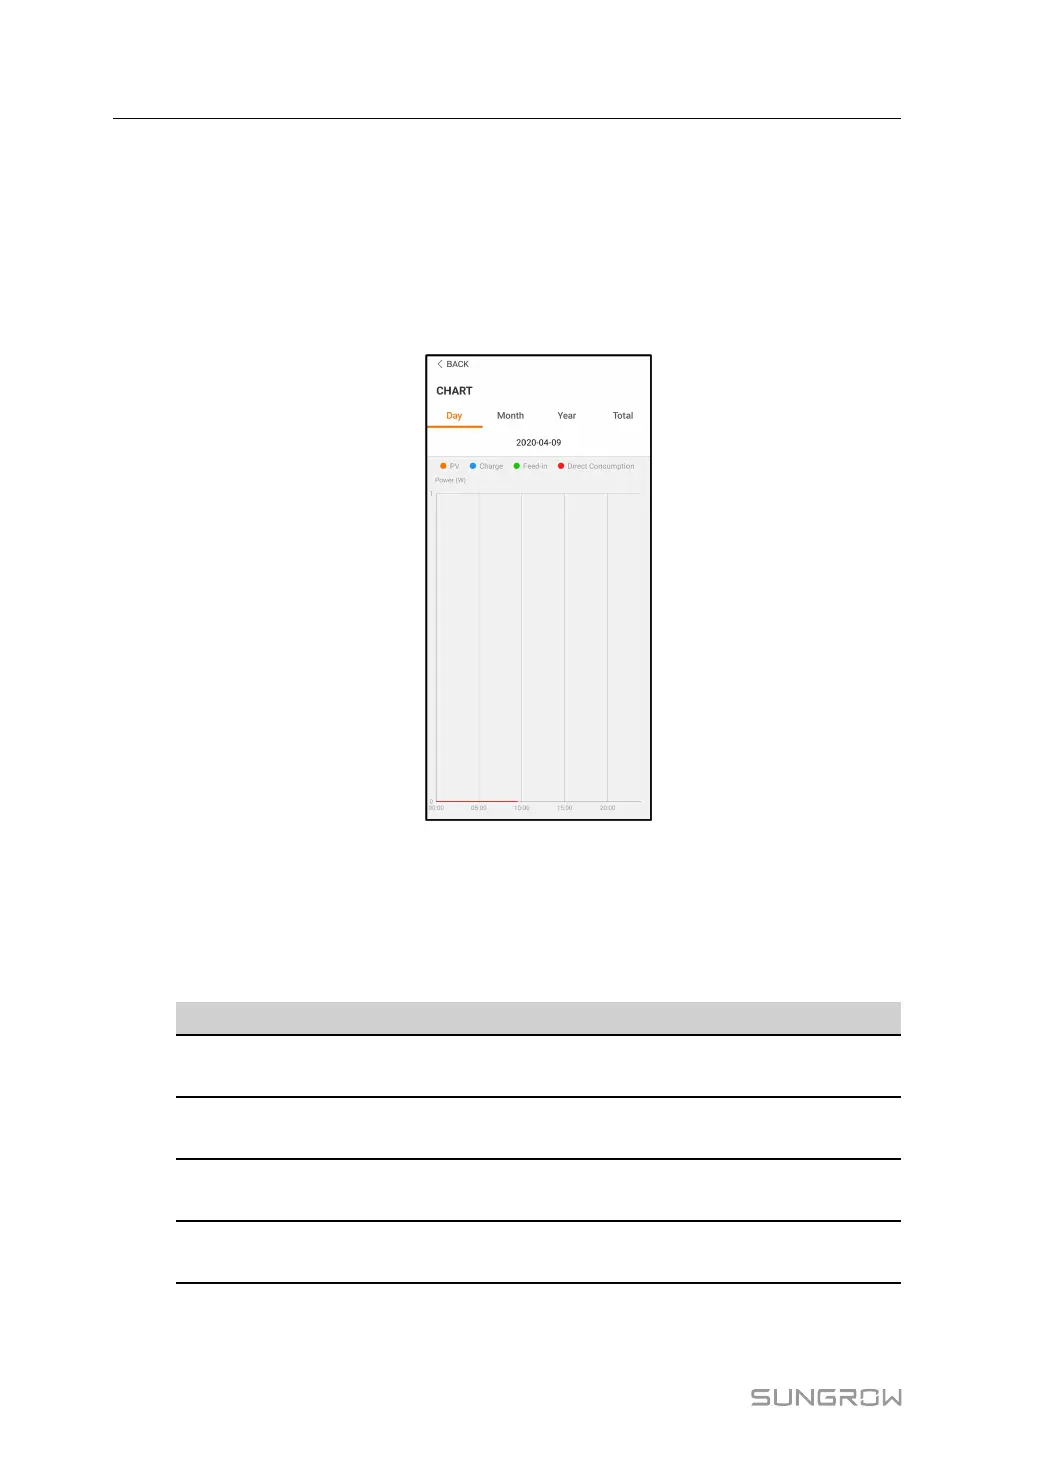
Tap Chart to enter the screen showing daily power generation, as shown in the following
figure.
figure 8-9 Power Curve
The App displays power generation records in a variety of forms, including daily power gen-
eration graph, monthly power generation histogram, annual power generation histogram,
and total power generation histogram.
table 8-5 Description of power generation records
Item Description
Daily power generation
graph
Indicates today power generation, charging, feed-in power,
and direct consumption power
Monthly power generation
histogram
Indicates monthly power generation, charging, feed-in
power, and direct consumption power
Annual power generation
histogram
Indicates annual power generation, charging, feed-in power,
and direct consumption power
Total power generation
histogram
Indicates total power generation, charging, feed-in power,
and direct consumption power
8 iSolarCloud App User Manual
 Loading...