Garmin G1000 Pilot’s Guide for the Socata TBM 850
190-00709-00 Rev. A6-36
HAZARD AVOIDANCE
WEATHER MAPPING AND INTERPRETATION
WEATHER DISPLAY INTERPRETATION
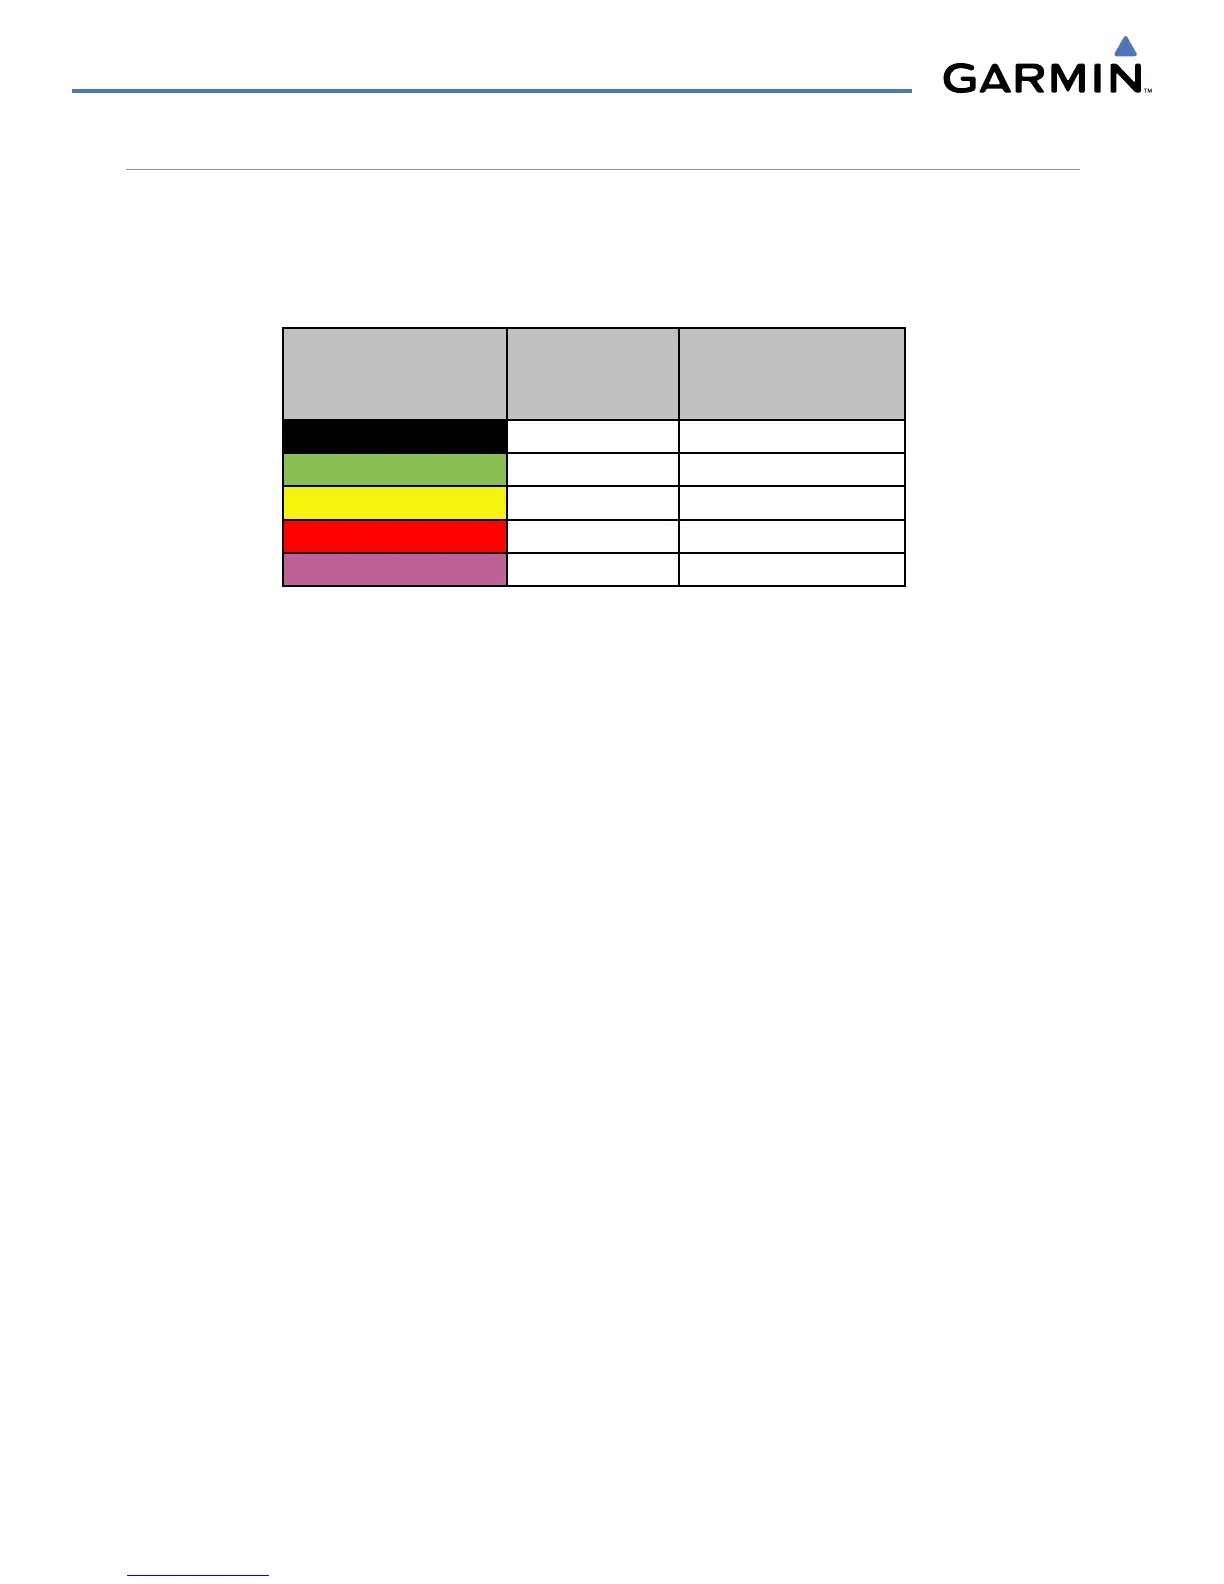
When evaluating various target returns on the weather radar display, the colors denote precipitation intensity
and rates shown in the table.
Weather Mode Color Intensity
Approximate
Precipitation Rate
(in/hr.)
Black < 23 dBZ < .01.
Green
23 dBZ to < 32 dBZ .01 - 0.1.
Yellow
32 dBZ to < 41 dBZ 0.1 - 0.5
Red 41 dBZ to < 50 dBZ 0.5 - 2
Magenta 50 dBZ and greater > 2
Table 6-3 Precipitation Intensity Levels
THUNDERSTORMS
Updrafts and downdrafts in thunderstorms carry water through the cloud. The more severe the drafts, the
greater the number and size of the precipitation droplets. With this in mind, the following interpretations
can be made from what is displayed on the weather radar. Avoid these areas by an extra wide margin.
• In areas where the displayed target intensity is red or magenta (indicating large amounts of precipitation),
the turbulence is considered severe.
• Areas that show steep color gradients (intense color changes) over thin bands or short distances suggest
irregular rainfall rate and strong turbulence.
• Areas that show red or magenta are associated with hail or turbulence, as well as heavy precipitation. Vertical
scanning and antenna tilt management may be necessary to identify areas of maximum intensity.

 Loading...