98
5 Functional Description with Process Diagrams
5.2.6.5 Process Sequence Chart
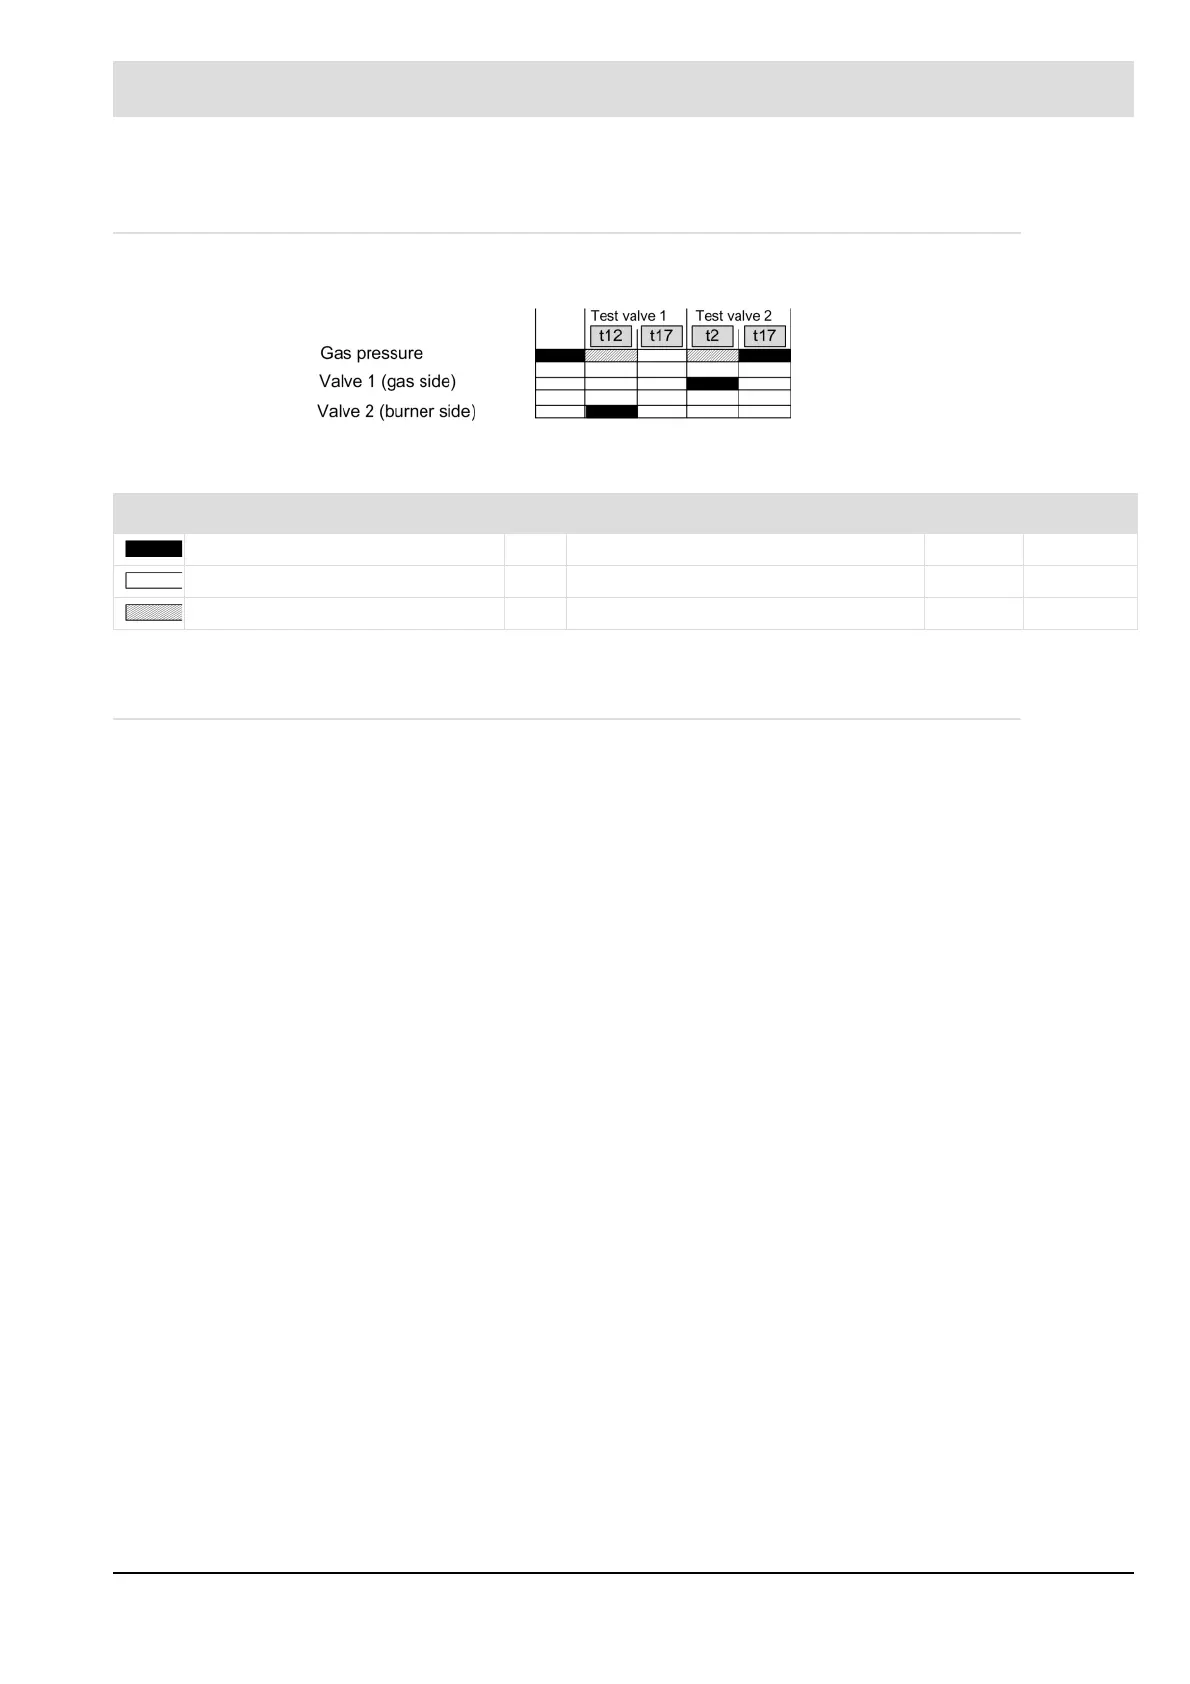
Principle sequence of a valve leakage test
Fig. 5-16 Principle sequence of a valve leakage test
* Calibrate name with parameter
5.2.6.6 Calculation Example
If the pressure monitor is also deployed to monitor the minimum gas pressure (logic signal ’Fu-
el train pressure > min’), the monitor must then be configured to the burner's minimum gas
pressure. If the pressure monitor is only deployed for the valve leakage test, the monitor must
be configured to half the gas inlet pressure p
ine
.
The valve leakage test time t3 is configured on the MCC burner control unit. t3 must be con-
figured so that the maximum permitted valve leakage rate Q
Leak
is reliably detected. In EN
1643 and ISO 23551-4, the maximum leakage rate is given as 0.1% nominal volumetric flow
of the gas or a minimum of 50 l/h.
Example 1
Burner output = 1000 kW
Fuel = H natural gas, calorific value = 10 kW/m
3
Nominal gas volumetric flow = 100 m
3
/h
Max. leakage rate = 0.1 m
3
/h or 100 l/h
Example 2
Burner output = 1000 kW
Fuel = propane, calorific value = 25.9 kW/m
3
Nominal propane volumetric flow = 38.6 m
3
/h
Max. leakage rate = 50 l/h (not 38.6 l/h)
Signal bar Significant times and their parameters Standard
Signal must be present. t2 Filling time of the gas train* P313 2.0 s
Signal must not be present. t12 Block and bleed time of the gas train* P334 3.0 s
Signal can be present. t17 Valve leakage test time P311 2.0 s
 Loading...