5.T osettheanimationdatetothecurrentdate
selectToday.
6.T osettheanimationdateto24hourspreviousto
thecurrentdateselectPreviousDay.
7.T osettheanimationdateto24hoursaheadof
thecurrentdateselectNextDay.
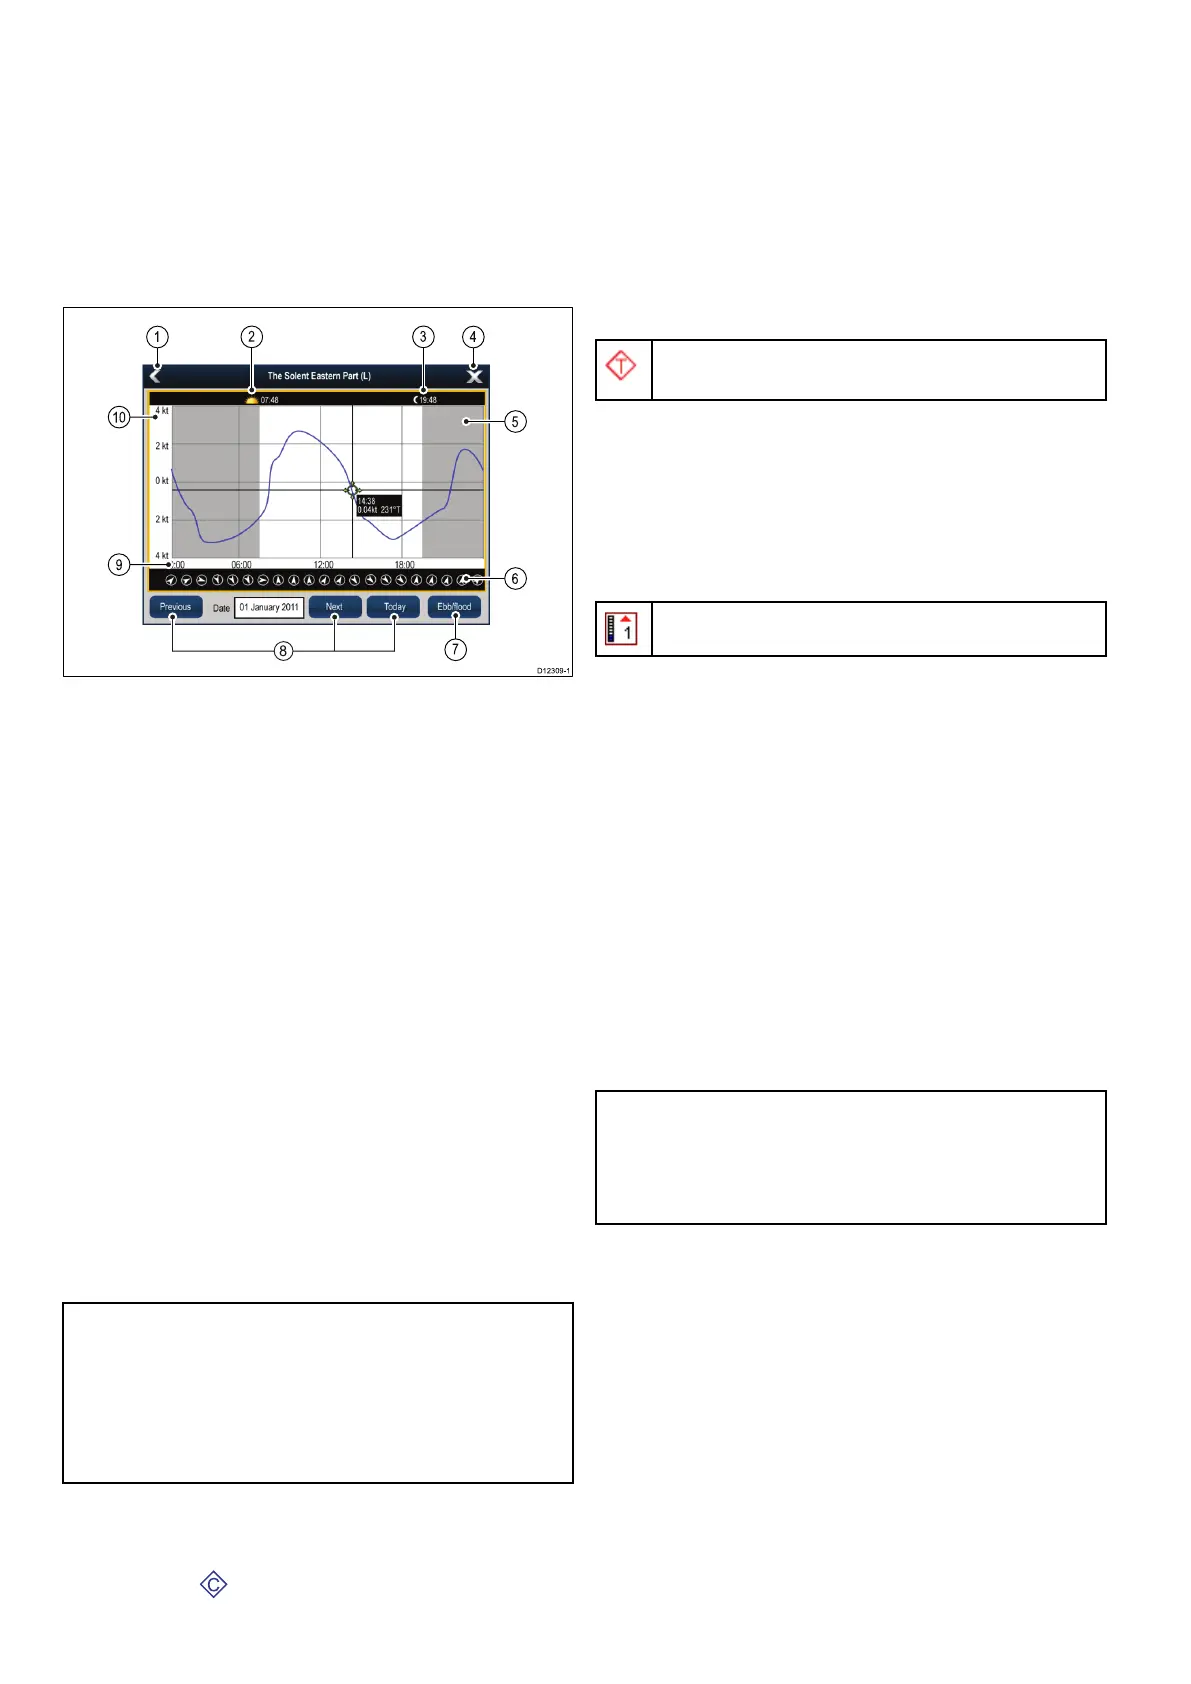
Currentgraphs
Currentgraphsprovideagraphicalviewofcurrent
activity.
1.Back—Returntothepreviousmenuorview.
2.Sunriseindicator—Indicateswhenthesun
rises.
3.Sunsetindicator—Indicateswhenthesun
sets.
4.Exit—Closesthedialog.
5.Nightfallindicator—Thegreyed-outsectionof
thegraphindicateswhennightfalloccurs.
6.Currentdirection—Indicatesthedirectionof
current(relativetonorth).
7.Ebb/Flood—Displaysalistshowingebb,slack
andoodtides.
8.Datenavigation—Usetheiconstomoveto
thenextorpreviousday.
9.Time—Thehorizontalaxisofthegraph
indicatestime,inaccordancewiththetime
formatspeciedintheUnitsSet-upoptions.
10.Currentspeed—Theverticalaxisofthe
graphindicatesspeed,inaccordancewiththe
speedpreferencesspeciedintheUnitsSet-up
options
Note:Thedataprovidedinthecurrentgraphsis
forinformationpurposesonlyandshouldNOTbe
relieduponasasubstituteforprudentnavigation.
Onlyofcialgovernmentchartsandnoticesto
marinerscontainallthecurrentinformationneeded
forsafenavigation.Alwaysmaintainapermanent
watch.
Displayingdetailsofcurrents
Fromthechartapplication:
1.Selectthe
diamond-shapedcurrenticon.
Thechartcontextmenuisdisplayed.
2.SelectCurrentStation.
Thegraphfortheselectedstationisdisplayed.
Tideinformation
Animatedtideinformation
Theelectronicchartsmayallowanimationofthetide
informationtidestations.
Animatedtideinformationisavailableinthechart
applicationwhereveradiamond-shapedsymbolwith
a"T"isdisplayed:
Thissymbolidentiestidestationsandtheavailability
oftideinformationforthelocation.
Whenyouselectatidestationsymbolthechart
contextmenuisdisplayed,whichprovidesthe
Animateoption.
WhenyouselectAnimatetheanimatemenuis
displayedandthediamond–shapedsymbolsare
replacedwithdynamictidebarwhichindicatesthe
predictedtideheightfortheactualtimeanddate:
Tideanimation.
•Tideheightisindicatedbyagauge.Thegaugeis
comprisedof8levels,whicharesetaccordingto
theabsoluteminimum/maximumvaluesofthat
particularday.
•Thecolorofthearrowonthetidegaugesindicates
changesinthetideheight:
–Red:increasingtideheight.
–Blue:decreasingtideheight.
Theanimationcanbeviewedcontinuouslyor
incrementallyatatimeintervalthatyouspecify.You
canalsosetthedatefortheanimation,andstartor
restarttheanimationatanypointwithina24-hour
period.Ifthesystemdoesnothaveavaliddateand
timethedateusedwillbemiddayforthesystem
defaultdate.
Note:Notallelectronicchartssupportthe
animatedtidesfeature.Checkwithyou
cartographyvendortoensurethefeaturesare
availableonyourchosencartographytypelevel
ortype.
Viewinganimatedtideinformation
Fromthechartapplication:
1.Selectdiamond-shapedtideicon.
Thechartcontextmenuisdisplayed.
2.SelectAnimate.
Theanimatemenuisdisplayedandthetideicon
isreplacedwithadynamictidebarindicator.
Controllinganimations
Fromthechartapplication,withtheanimatemenu
displayed:
1.T ostartorstoptheanimation,selectAnimate:to
switchbetweenPlayandPause.
186
LightHouseMFDoperationinstructions
 Loading...