You can display Ch 1 versus Ch 2 on two-channel models and Ch 3 versus Ch
4 on four-channel models.
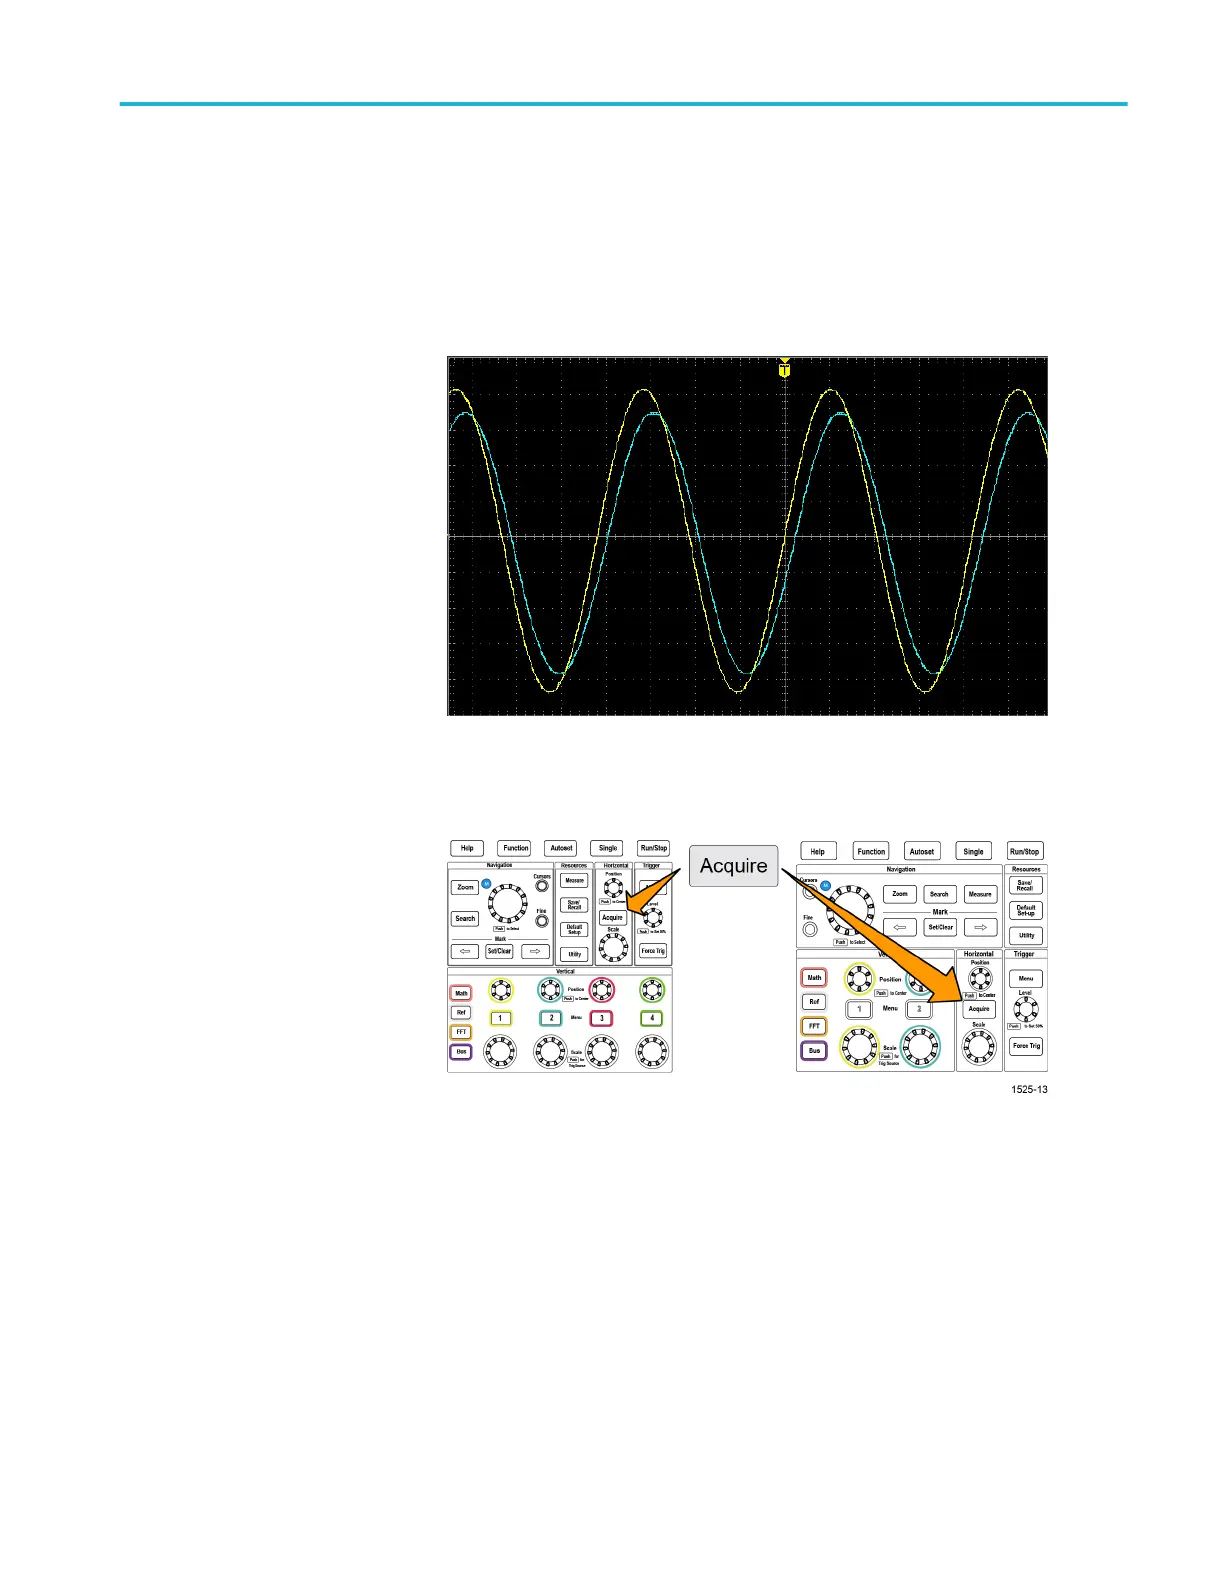
1. Select the two signal sources that you want to plot. Push the Vertical
Position knob for each channel to set the ground reference of both signals to
0 V (center horizontal graticule) so that the XY plot is centered on the screen.
2. Push Acquire.
Waveform display settings
TBS2000B Series Oscilloscopes User Manual 85
 Loading...