The XY display mode
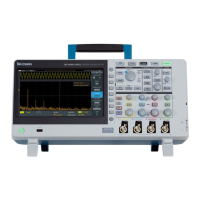
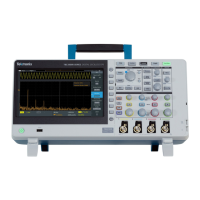
The XY display mode plots the signal amplitude of channel 1 (X) against the
amplitude of channel 2 (Y), where channel 1 is the horizontal axis and channel
2 is the vertical axis. XY display mode is useful for showing signal phase or
frequency relationships between periodic signals. The resulting XY plots are
called Lissajou patterns.
Waveform display settings
84 TBS2000B Series Oscilloscopes User Manual

 Loading...


