System Soft Key System Interface
4 - 24 Operator’s Manual of Anesthesia System
4.6.1.1.3 Display Interval
In the List Trends menu, you can set the display interval to [1 Min], [5 Min], [10 Min], [15 Min],
[30 Min], [1 Hour] and [2 Hour].
4.6.1.1.4 Display Group
In the List Trends menu, you can set the display group to [Gas], [Gas Flow], [Ventilator] and [All].
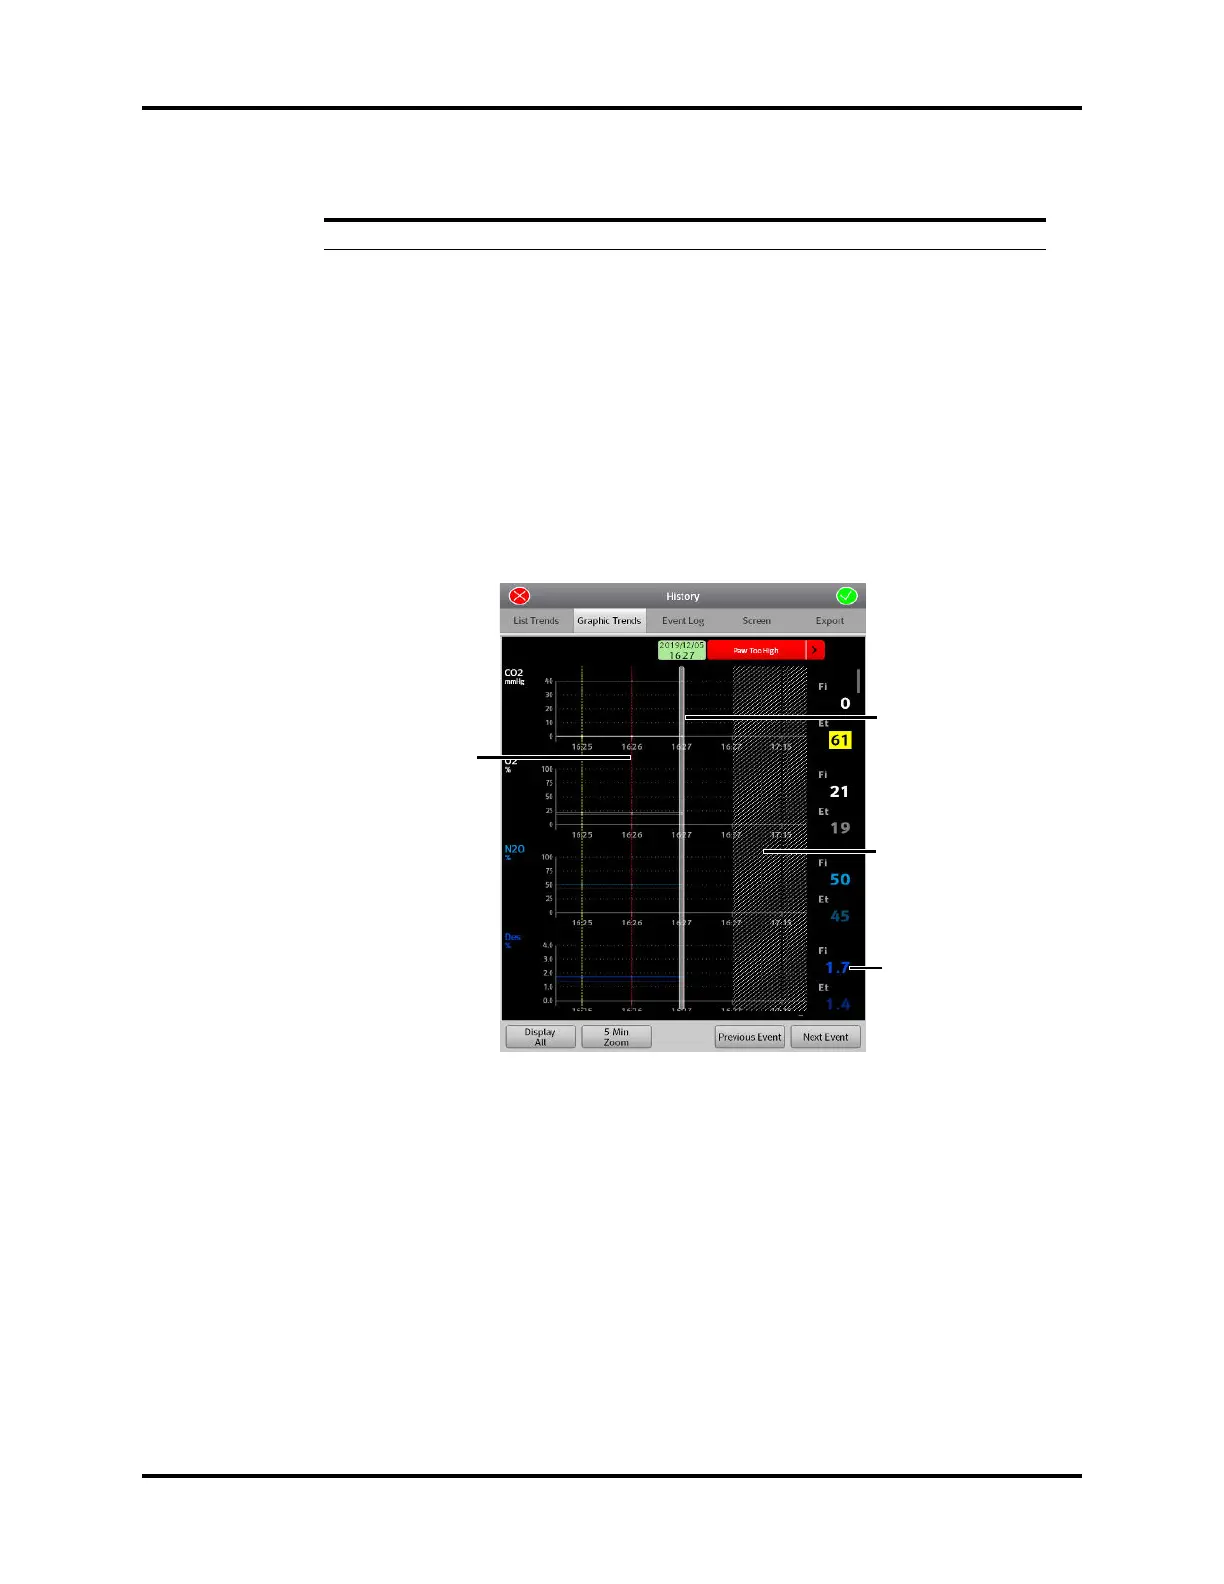
4.6.1.2 Graphic Trends
Graphic trends display allows the user to observe the trend of the physiological parameters.
The trend is reflected through a curve. Every point on the curve corresponds to the parameter value
at a specific time point. Graphic trends can also record standby and parameter alarm events Graphic
trend data automatically displays in one minute intervals unless the zoom is selected.
Figure 4-28 Graphic Trends
4.6.1.2.1 About Graphic Trends
• Graphic Trends store the data with the interval in 1 minute.
• Graphic Trends displays the trend records in descending order beginning with the most recent.
• Graphic Trends are not stored when the system is in standby.
• The display period of data is a rolling 48 hours of continuous data.
• Graphic Trends highlights the parameter data in the corresponding alarm color if an alarm condition existed
for the parameter at the time of trend record storage.
4.6.1.2.2 Graphic Trend Events Buttons
Drag the horizontal or vertical progress bar to view the updated trend data.
Next Event
The cursor moves from the current event to the next event.
Table 4-4 List Trend Events Buttons
BUTTON FUNCTION
Current cursor. The
corresponding time is
displayed on top of the
cursor. If an alarm is
issued at this time, the
corresponding alarm
information will also be
displayed on top of the
cursor.
A standby event
happened at this time
point.
The parameter data of
the time indicated by
cursor.
Event marker. The
dotted, colored line
indicates an event
occurred at that time.
Event includes standby
event and parameter
alarm event. A standby
event is marked with a
dotted line in white.
For physiological alarm
occurrence, the dotted
line is in the same color
as alarm. If multiple
events occurred, dotted
line is in same color as
the event of the highest
alarm level. The event
level can be specified as:
high alarm level event >
medium alarm level
event > low alarm level
event > capture event.
 Loading...