automatically on a home screen.
7.6.4. Bar graphs
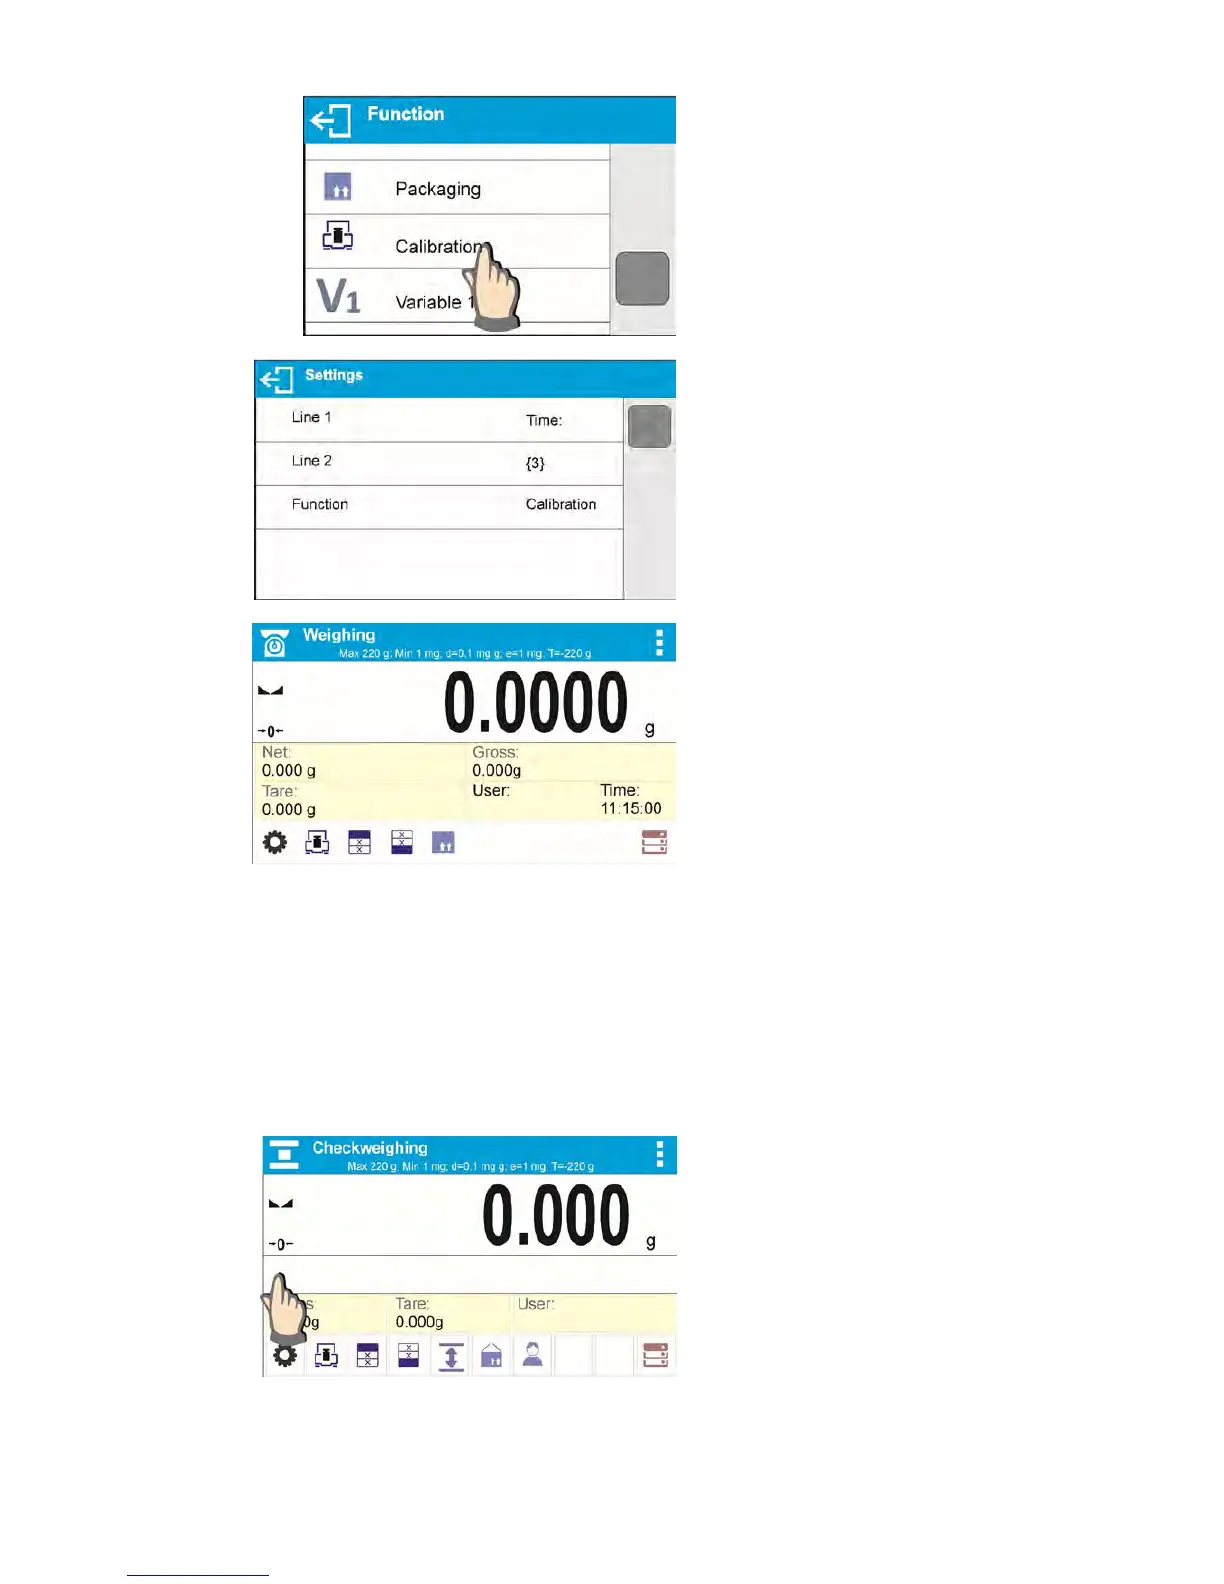
Bar graph function is accessible for all weighing modes. The bar graph presents in a graphic form
how much of balance capacity is in use. Additionally it shows Min and Max thresholds positions for
Checkweighing mode, and for Dosing mode it shows target weight value along with permissible
tolerance.
You can select bar graph size and turn on/off <Zoom> function. This function rescales bar graph in
order to improve visualization of indication.
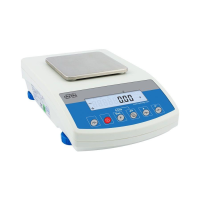
Procedure:
 Loading...