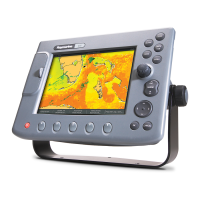
6 HSB Series Chartplotter
In addition, in chart or radar full-screen mode you can set
Windows On
to split the display into two half-screen windows for supplementary data
display as described below. The upper window shows the selected
mode (chart or radar); operating control defaults to the upper window,
but you can switch control between the radar and chart window with a
single key-press.
The following information, if available on your system, can be shown:
Full-Screen Mode Half-Screen Window Options
Chart CDI, BDI, Nav Data or Radar
Radar CDI, BDI, Nav Data or Chart
Data Log Not available
Half-screen Window Options
You can choose one of the following for display in the lower window:
• CDI: This gives the Course Deviation Indicator. It is a graphical display
showing the deviation from the required track with reference to the
target waypoint. The display also provides the cross track error (XTE)
distance, and the range, bearing and time to go (TTG) to the target
waypoint.
• BDI: This gives the Bearing Deviation Indicator. It is a graphical
display showing the deviation from the required bearing with
reference to the target waypoint. The display also provides the cross
track error (XTE) distance, and the range, bearing and time to go
(TTG) to the target waypoint.
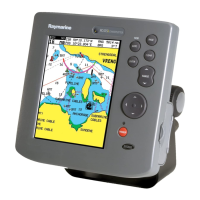
• Nav Data: This shows nine data boxes, providing navigational data in
the units specified in your set up. Note that up to six of these boxes are
also available as a user-selectable group (see Section 5.3 System
Parameters).
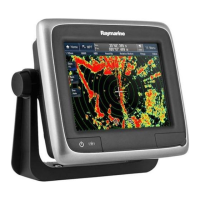
• Radar display: If radar data is available, either as a function of the
combined display unit or via the HSB link, it can be displayed. Refer to
the
Pathfinder HSB Series Radar Handbook
for detailed information.
Details on selecting windows are given in Chapter 2.
Operating
Modes
 Loading...