150
Chapter 8: Tables
7308ENG.DOC CH 8 Tables, English Julie Hewlett Revised: 07/29/98 12:08 PM Printed: 05/19/99 9:01 AM
Page 150 of 14
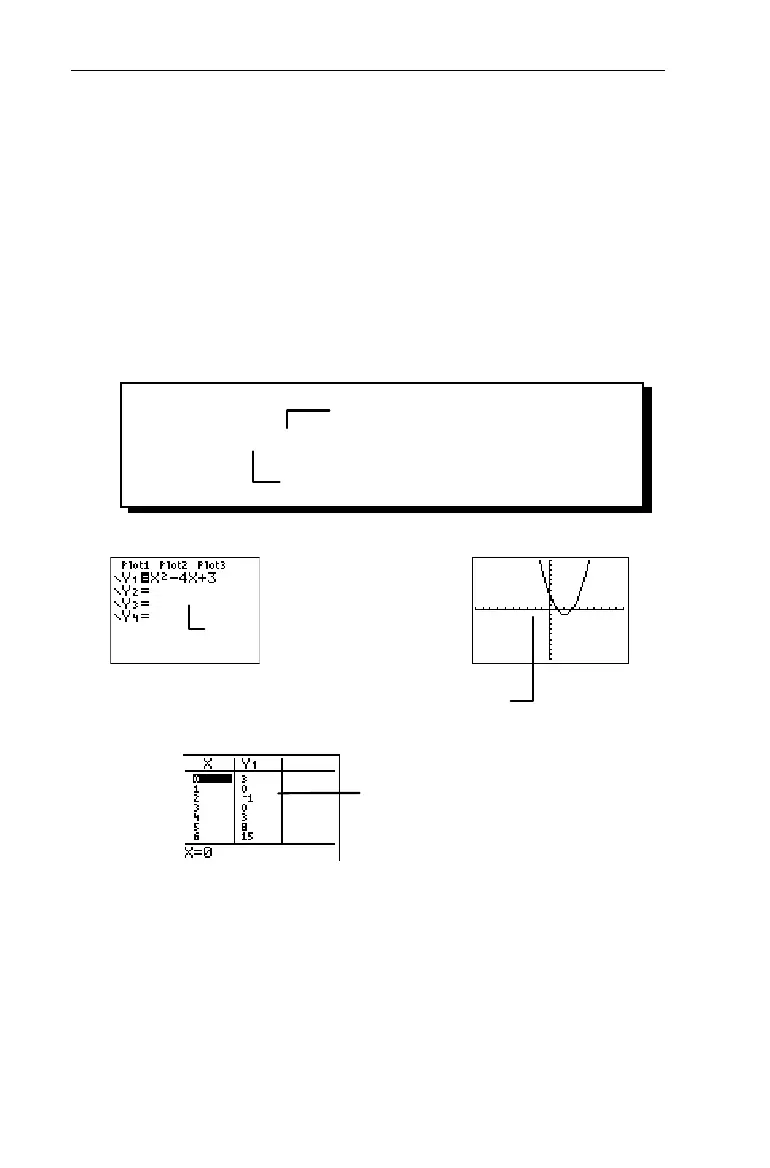
What Is a Table?
A table displays coordinate pair (
X
,
Y
) solutions for a defined
function. One column displays independent variable values
(
X
), and all others display corresponding dependent variable
values (
Y
).
On the TIN73, functions can be displayed in one of three ways,
as shown here with the function,
Y
1
=X
2
-4X+3
.
For more information about the Y= editor and function
graphing, see Chapter 9: Function Graphing.
The Y= editor (&) shows
an algebraic representation.
The Graph screen (*)
shows a graphic representation.
The Table screen (- i)
shows a numeric representation
in coordinate pairs.
Independent variable (X)
Dependent variable (Y)
Y= X
2
N4X+3
 Loading...