EasyManuals Logo
Home>Texas Instruments>Calculator>TI-73 Explorer

Texas Instruments TI-73 Explorer Guide Book

Texas Instruments TI-73 Explorer
364 pages
To Next Page IconTo Next Page
To Previous Page IconTo Previous Page
Page #177 background imageLoading...
Page #177 background image
Chapter 9: Function Graphing
171
7309ENG.DOC CH 9 Function Graphing, English Julie Hewlett Revised: 07/29/98 12:14 PM Printed: 05/19/99
9:01 AM Page 171 of 24
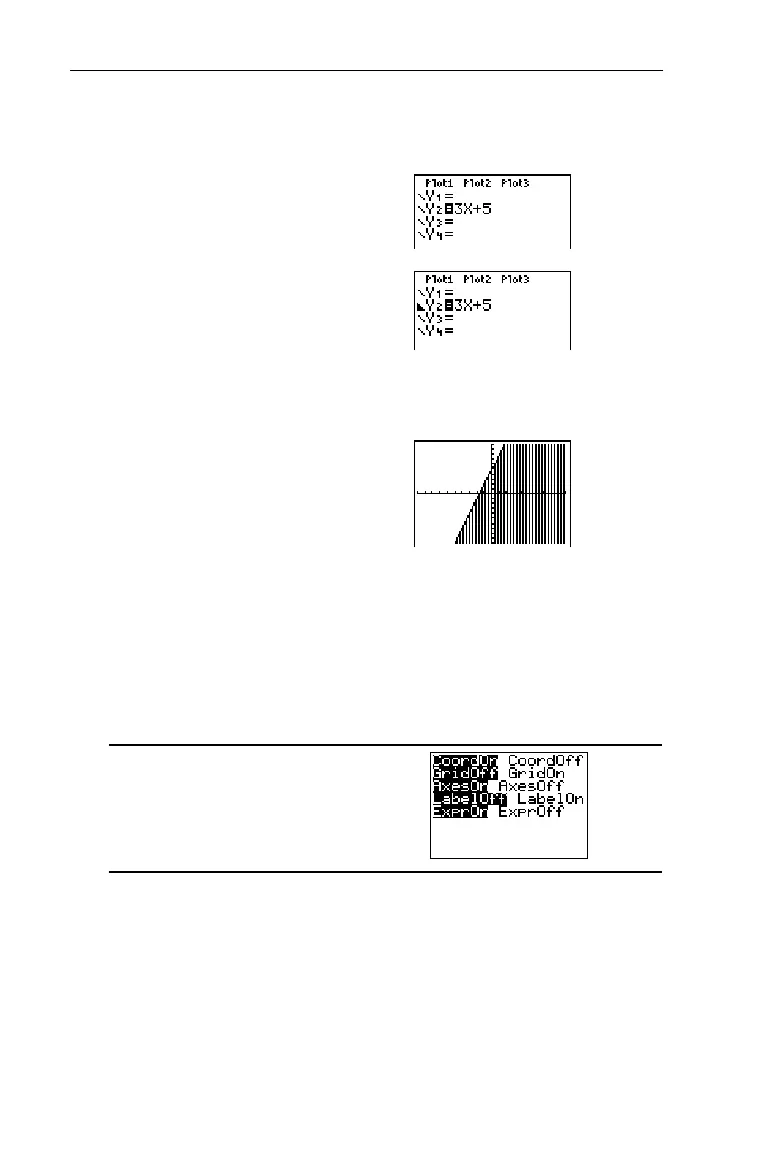
Set the
Below
graph style for Y
2
=3X+5.
1. Enter the Y= editor and
define
Y
2
=3X+5
.
&#:
3
I\
5
2. Highlight the graph style
icon (to the left of the
Y
2
)
and select the graph style,
Below
.
!!!!!!
bbb
3. Display the graph.
(
6
Setting the Window Format
-
g
The window format screen lets you choose display settings.
These apply to function graphing and statistical plotting.
-g
³

Table of Contents

Other manuals for Texas Instruments TI-73 Explorer

Questions and Answers:

Question and Answer IconNeed help?

Do you have a question about the Texas Instruments TI-73 Explorer and is the answer not in the manual?

Texas Instruments TI-73 Explorer Specifications

General IconGeneral
BrandTexas Instruments
ModelTI-73 Explorer
CategoryCalculator
LanguageEnglish

Related product manuals