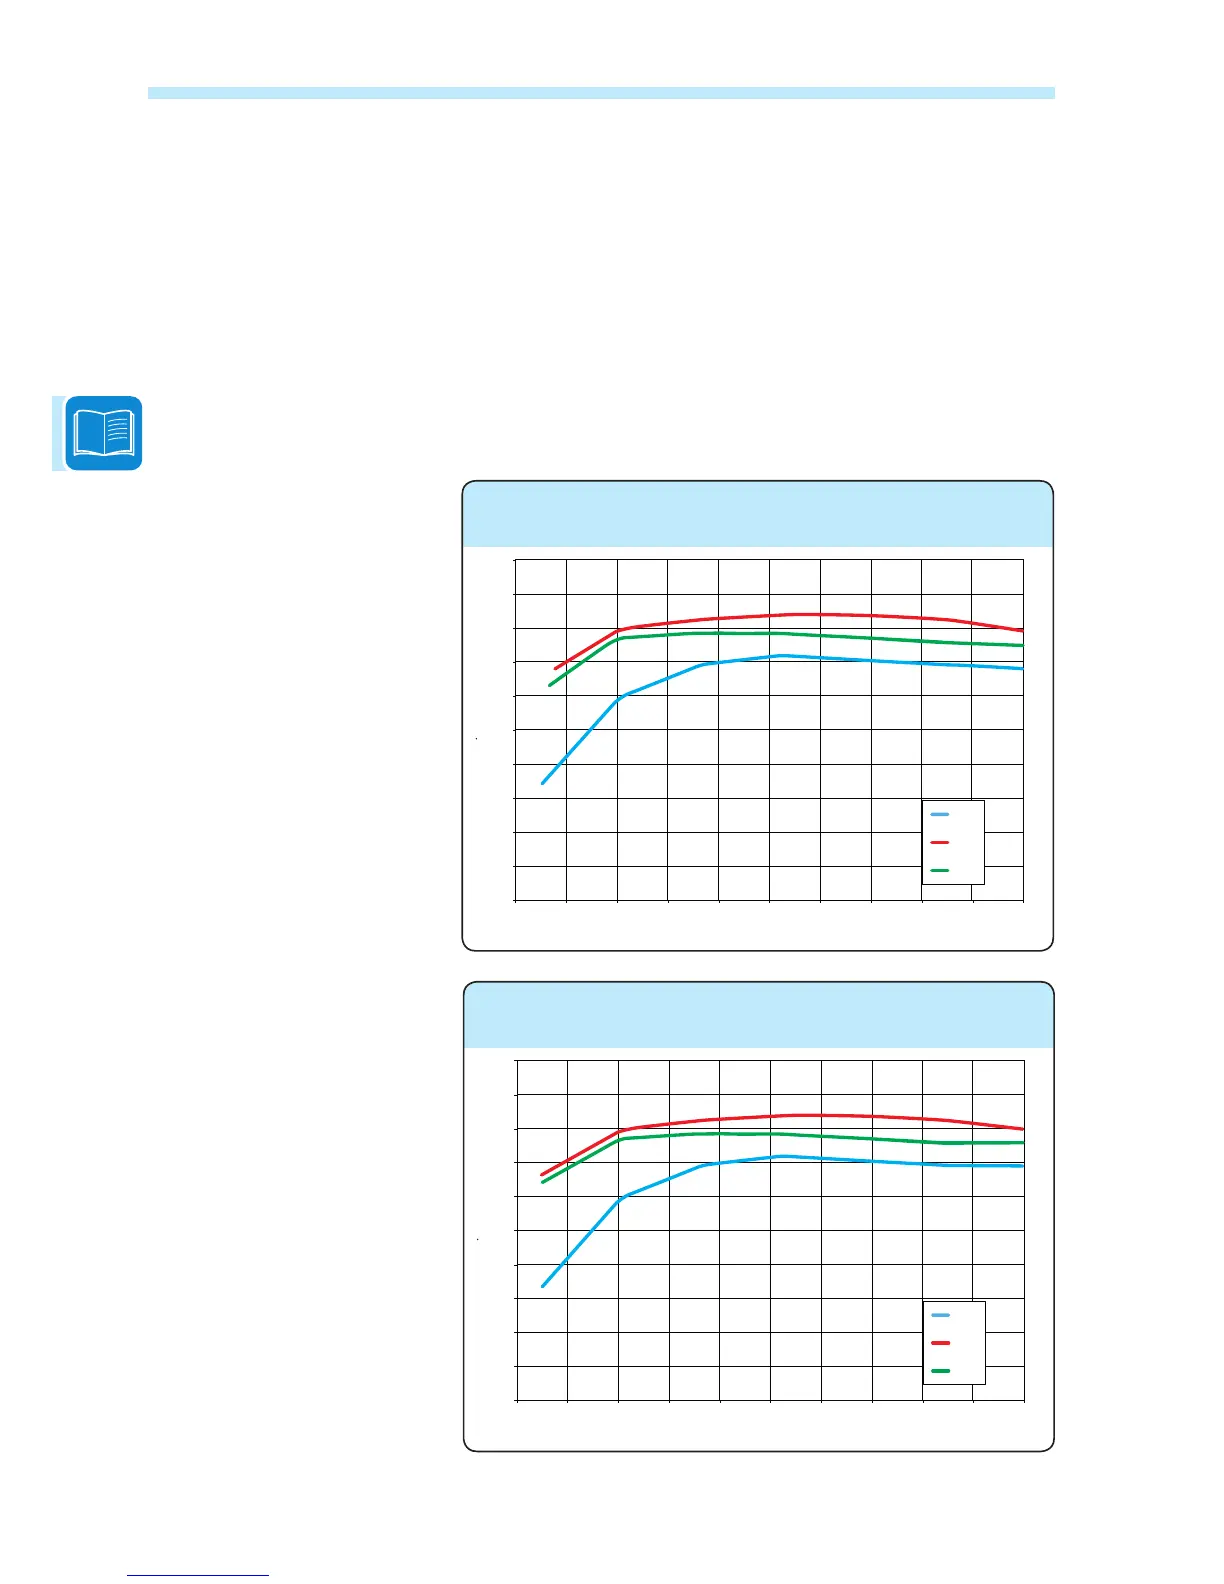
Efficiency curves
The equipment was designed in consideration of current energy conser-
vation standards, to avoid waste and unnecessary leakage.
Graphs of the efciency curves of all models of inverter described in this
manual are shown below.
The efciency curves are linked to technical parameters that are continually being developed
and improved and should therefore be considered approximate.
TRIO-20.0-TL-OUTD-400
TRIO-20.0-TL-OUTD-S2-400
TRIO-20.0-TL-OUTD-S2F-400
TRIO-20.0-TL-OUTD-S2X-400
TRIO-27.6-TL-OUTD-400
TRIO-27.6-TL-OUTD-S2-400
TRIO-27.6-TL-OUTD-S2F-400
TRIO-27.6-TL-OUTD-S2X-400
90
91
92
93
94
95
96
97
98
99
100
Eciency, %
% of Rated Output Power
500 Vdc
620 Vdc
800 Vdc
0% 10% 20% 30% 40% 50% 60% 70% 80% 90% 100%
Efciency curves
90
91
92
93
94
95
96
97
98
99
100
Eciency, %
% of Rated Output Power
500 Vdc
620 Vdc
800 Vdc
0% 10% 20% 30% 40% 50% 60% 70% 80% 90% 100%
Efciency curves
 Loading...