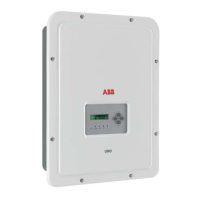
Derating due to the input voltage
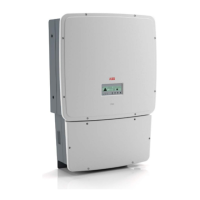
The graphs show the automatic reduction of supplied power when input
voltage values are too high or too low.
TRIO-20.0-TL-OUTD-400
TRIO-20.0-TL-OUTD-S2-400
TRIO-20.0-TL-OUTD-S2F-400
TRIO-20.0-TL-OUTD-S2X-400
TRIO-20.0-TL-OUTD-400
TRIO-20.0-TL-OUTD-S2-400
TRIO-20.0-TL-OUTD-S2F-400
TRIO-20.0-TL-OUTD-S2X-400
TRIO-27.6-TL-OUTD-400
TRIO-27.6-TL-OUTD-S2-400
TRIO-27.6-TL-OUTD-S2F-400
TRIO-27.6-TL-OUTD-S2X-400
TRIO-20.0-TL-OUTD-400
TRIO-20.0-TL-OUTD-S2-400
TRIO-20.0-TL-OUTD-S2F-400
TRIO-20.0-TL-OUTD-S2X-400
TRIO-27.6-TL-OUTD-400
TRIO-27.6-TL-OUTD-S2-400
TRIO-27.6-TL-OUTD-S2F-400
TRIO-27.6-TL-OUTD-S2X-400
0
5000
10000
15000
20000
25000
Pout [W]
Vin [V]
0 100 200 300 400 500 600 700 800 900 1000
Pout Vs. Vin
Parallel input conguration
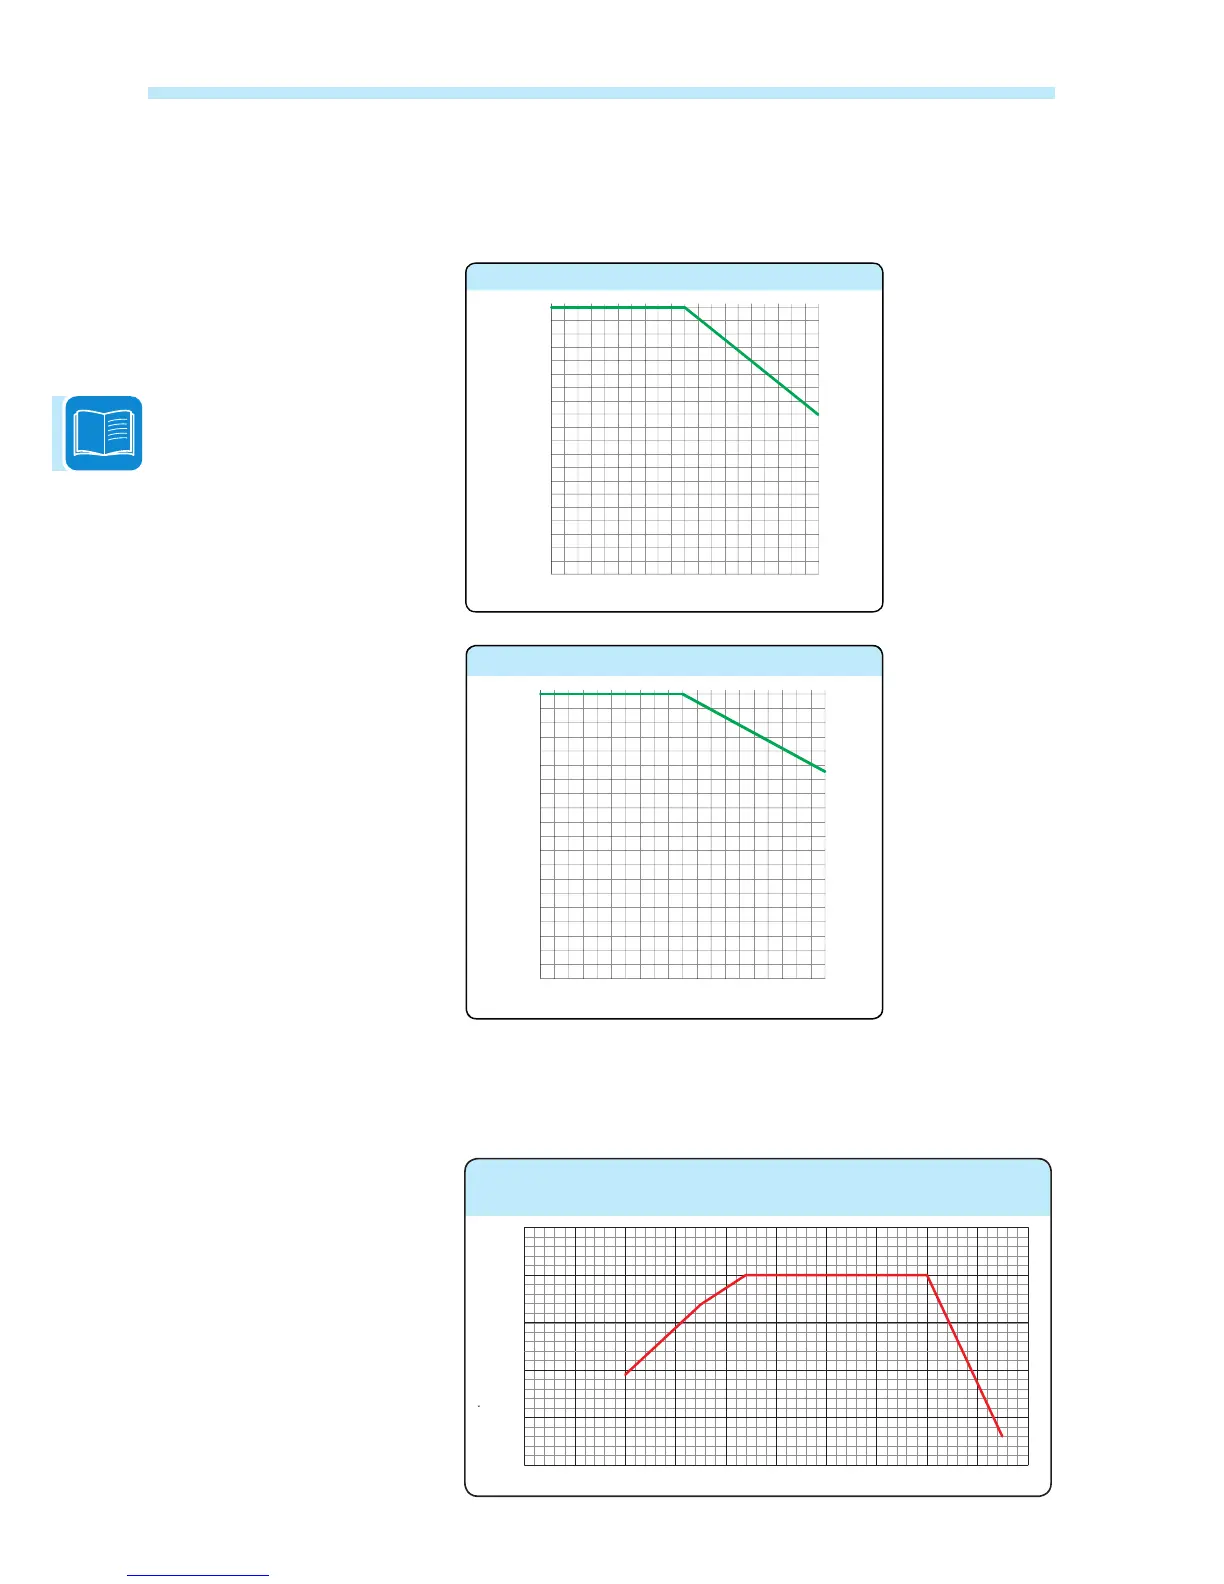
Derating due to the altitude of the installation
The graphs show the derating as a function of the altitude of the instal-
lation.
50
75
100
%Maximum Input Voltage [V]
95
90
85
80
70
65
60
55
1000
3280
1200
3937
1400
4593
1600
5249
1800
5905
2000
6561
Altitude [mt and ft]
2200
7217
2400
7874
2600
8530
2800
9186
3000
9842
Altitude Vs Max input voltage
50
75
100
Normalized temperature(Tmax derated / Tmax sea level)
95
90
85
80
70
65
60
55
 Loading...