48
Setting
Selecting Color Space
See the below table for available color space.
* Factory default setting : L
v
xy
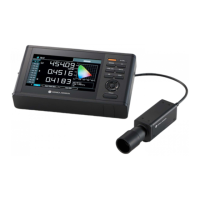
Color space
LCD screen
Display description
(When Normal is selected
(When Index is selected for
L
v
xy*1
SPD
CMF
SYN
[
Hz
]
ACC
cd
m
2
Lv
49.66
0 . 4045
0 . 4088
x
y
SPD
CMF
SYN
[
Hz
]
ACC
cd
m
2
Lv
4.9662E+1
0 . 4045
0 . 4088
x
y
Displays and outputs in
luminance L
v
and
chromaticity coordinates x,
y.
L
v
u’v’*1
SPD
CMF
SYN
[
Hz
]
ACC
cd
m
2
Lv
49.66
0 . 2280
0 . 5185
u’
v’
SPD
CMF
SYN
[
Hz
]
ACC
cd
m
2
Lv
4.9662E+1
0 . 2280
0 . 5185
u’
v’
Displays and outputs in
luminance L
v
and u’v’
chromaticity diagram (CIE
1976 UCS chromaticity
diagram) coordinates u’, v’.
L
v
T ∆uv
SPD
CMF
SYN
[
Hz
]
ACC
cd
m
2
Lv
49.66
3657K
+0.008
Tcp
duv
SPD
CMF
SYN
[
Hz
]
ACC
cd
m
2
Lv
4.9662E+1
3657K
+0.008
Tcp
duv
luminance L
v
, correlated
color temperature T and
color difference from black
body locus ∆uv.
XYZ
SPD
CMF
SYN
[
Hz
]
ACC
cd
m
2
X
49.14
49.66
22.67
Y
Z
SPD
CMF
SYN
[
Hz
]
ACC
cd
m
2
X
4.9137E+1
4.9662E+1
2.2672E+1
Y
Z
Displays and outputs in
tristimulus values X, Y, Z.
Dominant
wavelength /
Excitation
purity*2
MEAS SNGL
UC00
SPD
CMF
SYN
[
Hz
]
ACC
λd
+577.328nm
44.14%
Pe
1
˚
Displays and outputs in
dominant wavelength λd
and excitation purity P
e
.
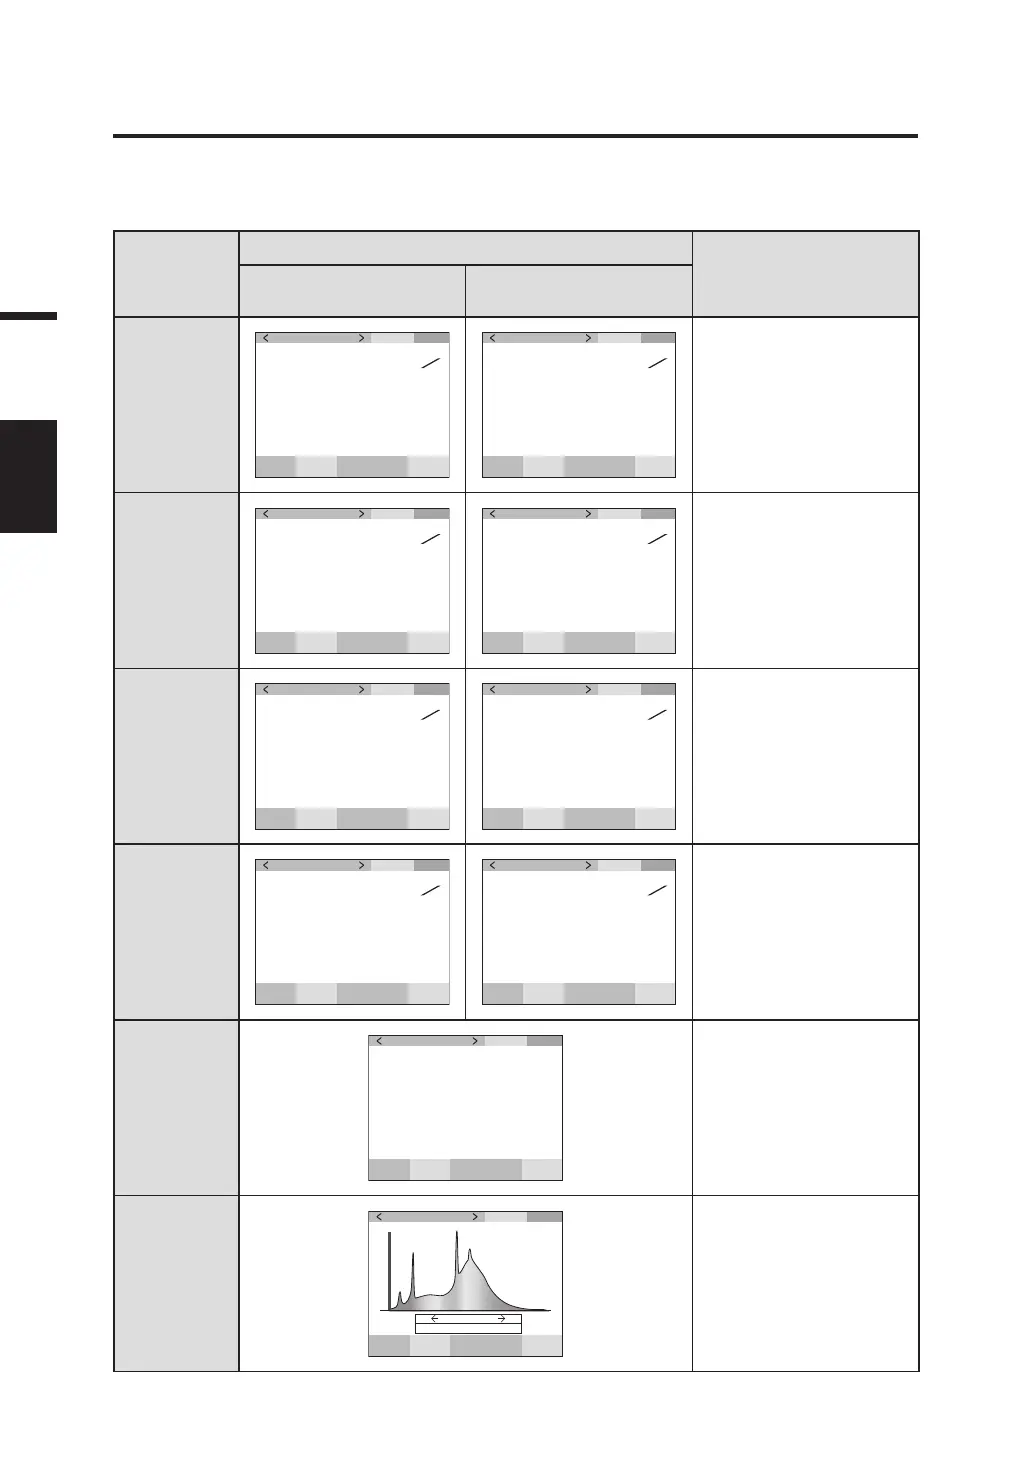
Spectral graph
UC00
380
380n
m
0.0000E+0
780
1
˚
SPD
CMF
SYN
[
Hz
]
ACC
Displays or outputs spectral
radiance L
e
(λ) in the
spectral waveform
 Loading...