-
49
-
'15 • HM-T-246
2.7 Performance correction method by the effects of outdoor relative humidity
It is necessary to get the data of the annual minimum outdoor temperature and relative humidity of the place where CO
2
heat
pump water heater will be installed.
[E xample1] In case of outdoor air temperature –6 (° CDB) and relative humidity 90
%
(
Hotwater outlet temperature 60° C/Feed water temperature 5° C)
・
Heating capacity is 30kW according to the perforamance charcteristics curve for operation to top up.
・
COP is 2.90 according to the perforamance charcteristics curve for operation to top up.
・
Correction coeffcient is 0.85 according to heating performance coeffcient curve for operation to top up.
・
Capacity after correction 25.5 kW = 30kW
×
0.85
・
COP after correction 2.465 = 2.90
×
0.85
[E xample2] In case of outdoor air temperature –10 (° CDB) and relative humidity 73
%
(
Hotwater outlet temperature 60° C/Feed water temperature 5° C)
・
Heating capacity is 28.5kW according to the perforamance charcteristics curve for operation to top up.
・
COP is 2.79 according to the perforamance charcteristics curve for operation to top up.
・
Correction coeffcient is 0.95 according to heating performance coeffcient curve for operation to top up.
・
Capacity after correction 27.1 kW = 28.5kW
×
0.95
・
COP after correction 2.65 = 2.79
×
0.95
<
N otes
>
(1) This chart is based on the capacity measurements with actual use conditions and capacity decrease with
defrost operation is considered, but performance values vary depending on installation or weather conditions
when using.
(2) P ower consumption is read on the “Heating performance characteristics curve for the operation to top up”
without correction (COP is given by P erformance ÷ P ower consumption, so the correction of this chart is also
applied to the COP ).
(3) This chart is applicable for all “Heating performance characteristics curve for the operation to top up”, except
the curves for recirculation system in which feed inlet water temperature is higher than 40° C .
Perf ormance correction meth od b y th e ef f ects of outdoor relativ e h umidity
I t is necessary to get th e data of th e annual minimum outdoor temperature and relativ e h umidity of th e place
wh ere Q -ton will b e installed.
[ E x ample1 ] I n case of outdoor air temperature -6 ( 䉝DB) and relativ e h umidity 9 0䠂
䠄Hotwater outlet temperature6 0䉝/ Feedwater temperature 5䉝)
䞉Heating capacity is 30k W according to th e perf oramance ch arcteristics curv e f or operation to top up.
䞉C O P is 2 . 9 0 according to th e perf oramance ch arcteristics curv e f or operation to top up.
䞉C orrection coef f cient is 0. 8 5 according to Heating perf ormancecoef f cient curv e f or operation to top up.
䞉C apacity af ter correction 2 5. 5 k W = 30k W x 0. 8 5
䞉C O P af ter correction 2 . 4 6 5 = 2 . 9 0 x 0. 8 5
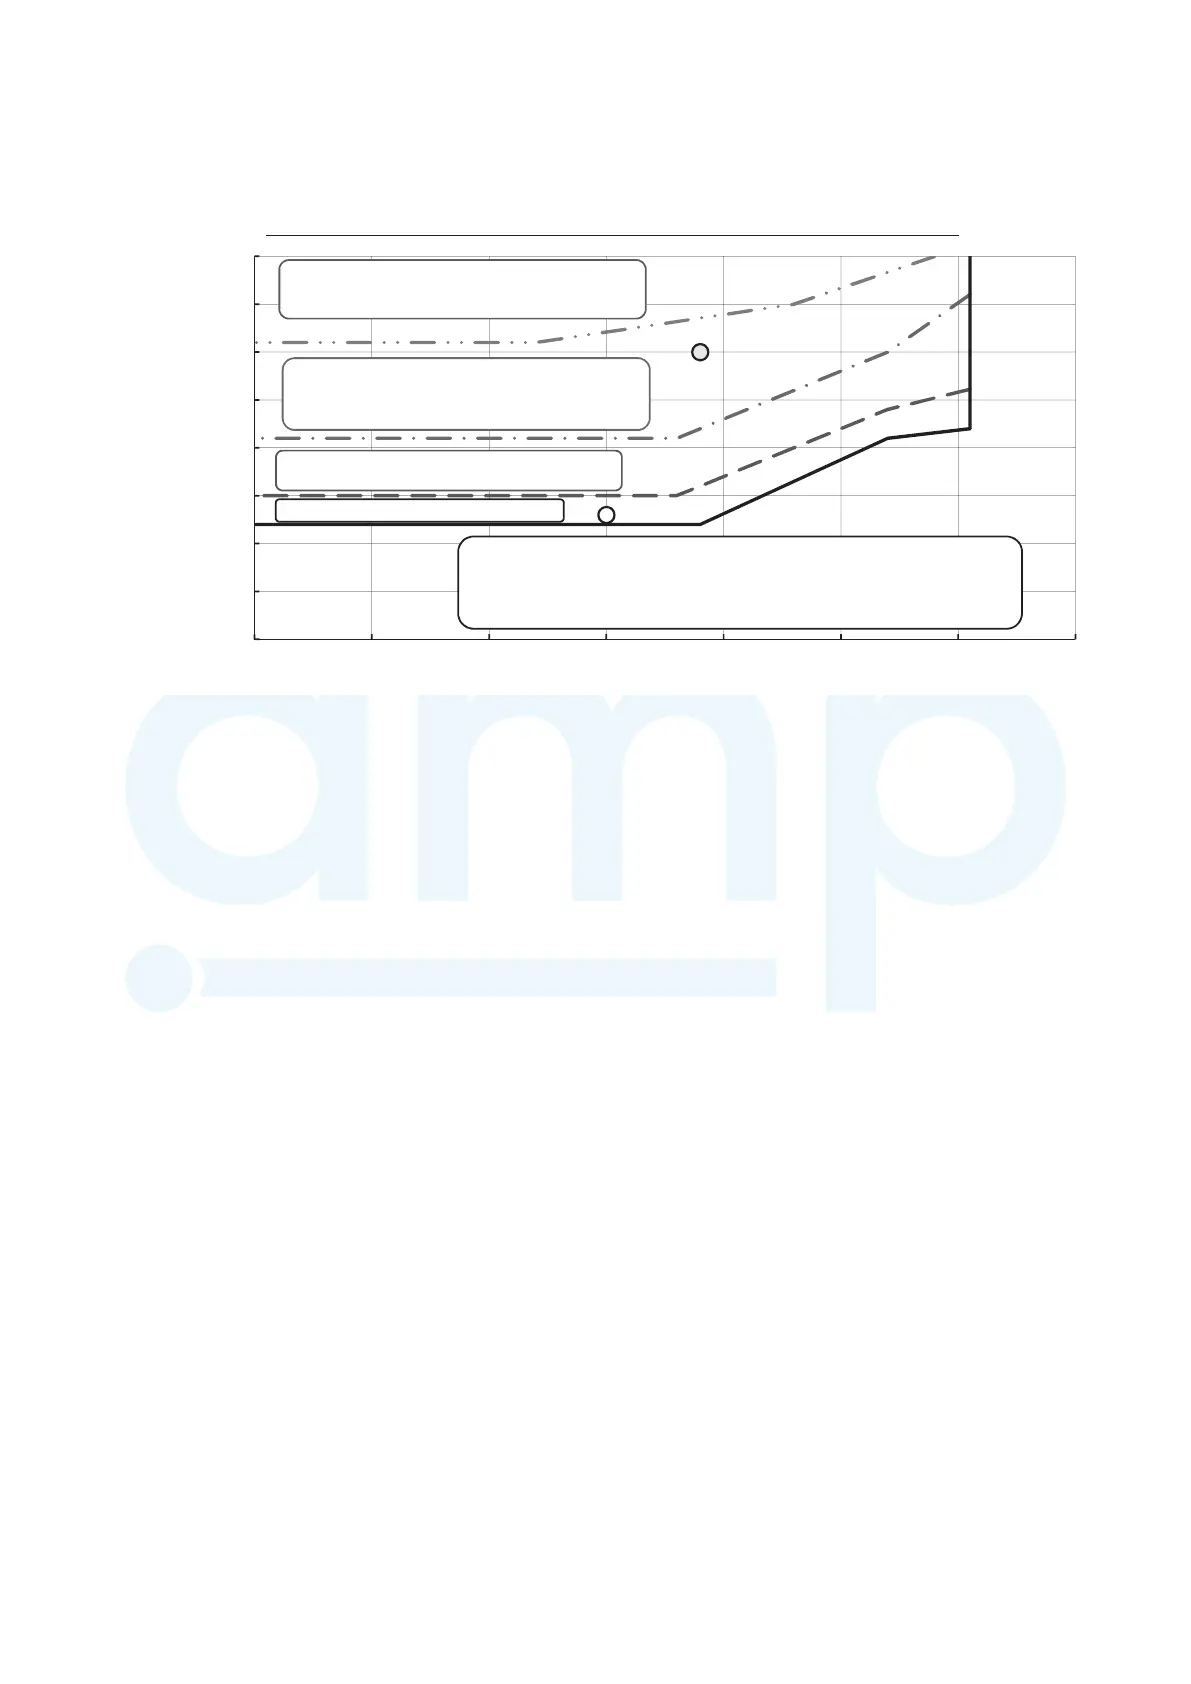
E x ample1
E x ample2
6 0
6 5
7 0
7 5
8 0
8 5
9 0
9 5
1 00
-2 5 -2 0 -1 5 -1 0 -5 0 5 1 0
O utdoor relativ e h umidity 䠄䠂)
䠄䉝
䠅
Heating perf ormance correction coe f f icient ch art f or th e operation to top up in R H
0. 8 5 correction coef f icient z one
0. 8 0 correction coef f icient z one
0. 9 0 correction coef f icient z one
1 . 0 correction coef f icient z one
䠄N o correctiion䠅
0. 9 5 correction coef f icient z one
C O Paf ter correction 2 . 4 6 5 2 . 9 0x 0. 8 5
[ E x ample2 ] I n case of outdoor air temperature -1 0( 䉝DB) and relativ e h umidity 7 3䠂
䠄Hotwater outlet temperature6 0䉝/ Feedwater temperature 5䉝)
䞉Heating capacity is 2 8 . 5k W according to th e perf oramance ch arcteristics curv e f or operation to top up.
䞉C O P is 2 . 7 9 according to th e perf oramance ch arcteristics curv e f or operation to top up.
䞉C orrection coef f cient is 0. 9 5 according to Heating perf ormancecoef f cient curv e f or operation to top up.
䞉C apacity af ter correction 2 7 . 1 k W = 2 8 . 5k W x 0. 9 5
䞉C O P af ter correction 2 . 6 5 = 2 . 7 9 x 0. 9 5
䠘N ote䠚 1 . T h is ch art is b ased on th e capacity measurements with actual use conditions and capacity decrease
with def rosting is considered, b ut perf ormance v alues v ary depending on installation or weath er conditions
wh en using.
2 . Power consumption is read on th e “ Heating perf ormance ch aracteristics curv e f or th e operation to top up”
with out correction ( C O P is giv en b y Perf ormance ÷ Power consumption,
so th e correction of th is ch art is also applied to th e C O P).
www.ampair.co.uk | sales@ampair.co.uk
 Loading...