80 Publication 2711C-QS001F-EN-P - November 2010
Chapter 7 Create the Motor Speed Screen
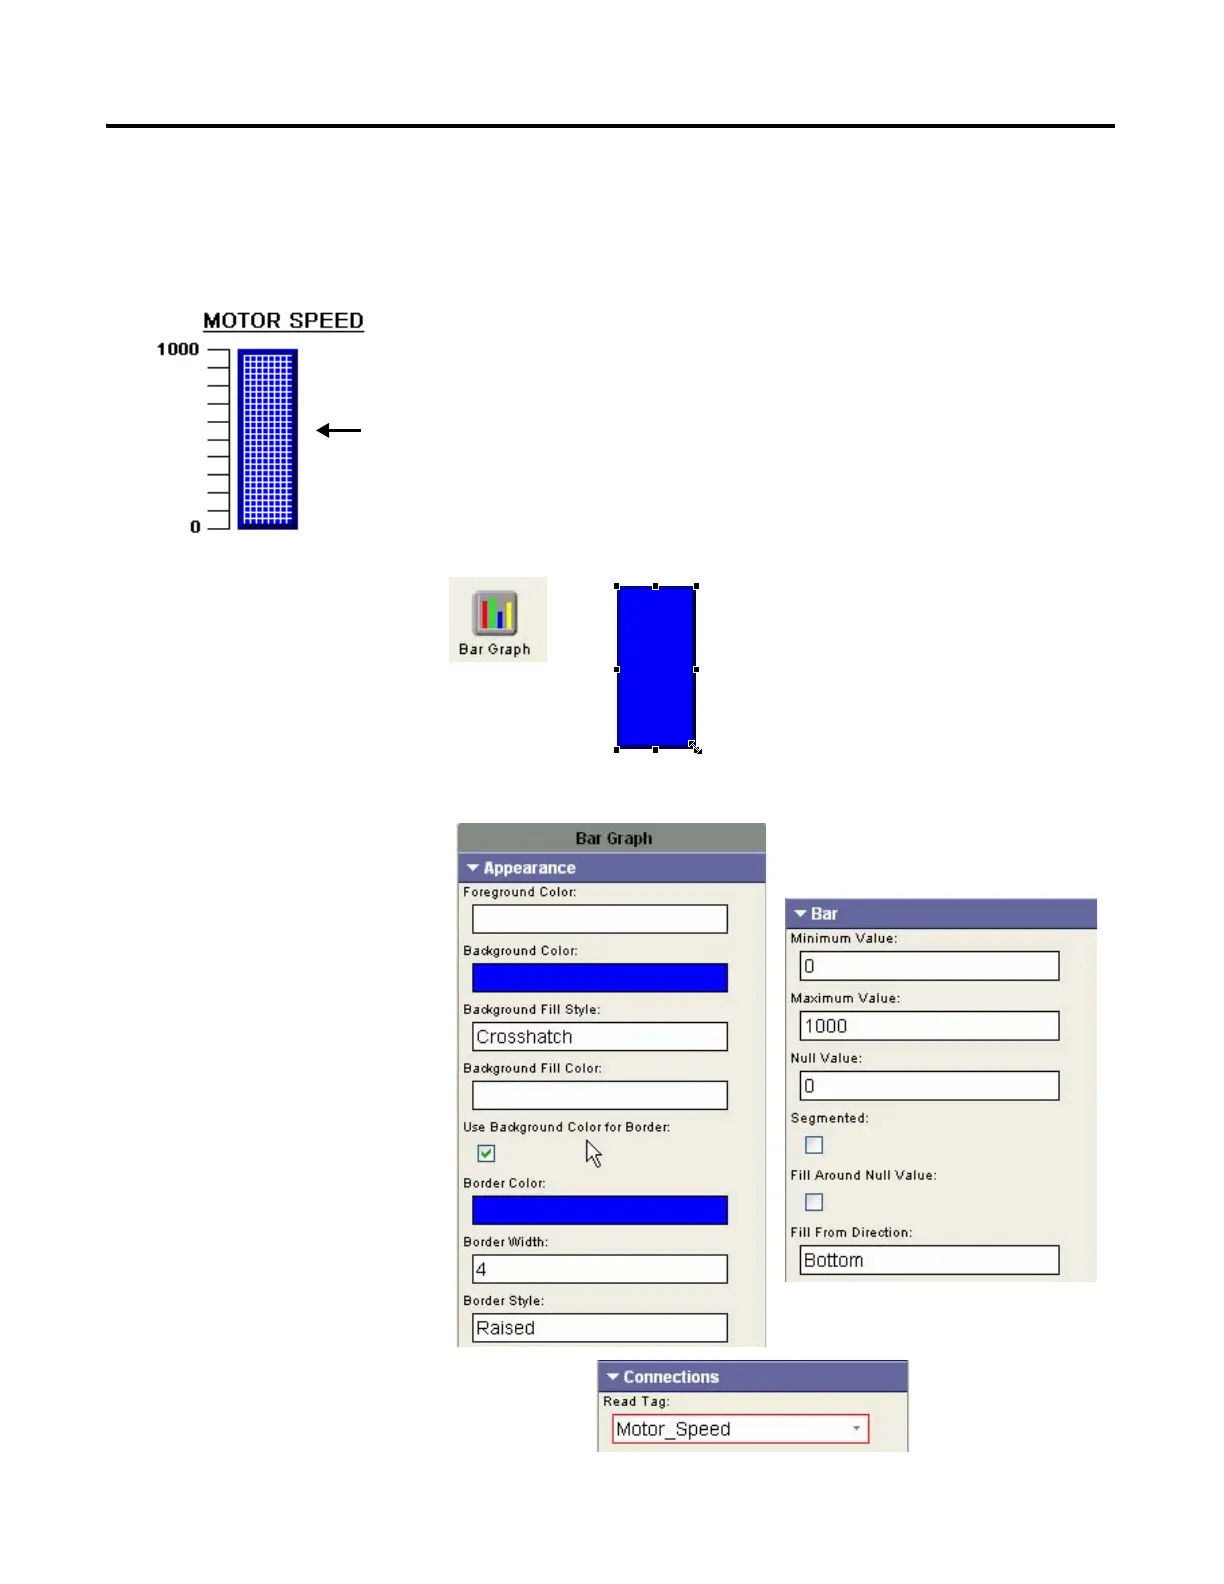
Create a Bar Graph
The bar graph monitors and displays the speed of the motor in a graphic form.
1. Open the Display tab of the
object palette.
2. Drag the Bar Graph object
to the right side of the
screen.
3. Resize the bar graph.
4. On the Appearance tab, set
the Background Fill Style to
Crosshatch.
5. On the Bar tab:
a. Set the Maximum Value
to 1000.
b. Select Bottom for the
Fill From Direction.
6. On the Connections tab,
select Motor_Speed as the
Read Tag.
 Loading...