Previews 110
Additional Graphing Topics
Additional Graphing TopicsAdditional Graphing Topics
Additional Graphing Topics
From the Home screen, graph the piecewise defined function: y = Lx when x < 0 and
y=5cos(x) when x‚ 0. Draw a horizontal line across the top of the cosine curve. Then
save a picture of the displayed graph.
Steps and keystrokes Display
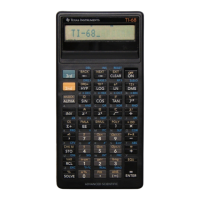
1. Display the MODE dialog box. For Graph
mode, select
FUNCTION. For Angle mode,
select
RADIAN.
Press 3 B 1 D D D B 1 ¸
2. Display the Home screen. Use the
Graph
command and the
when function to
specify the piecewise defined function.
†
2 selects Graph from the Other toolbar
menu and automatically adds a space.
Press " † 2 2 ™ WHEN j
c X 2 Â 0 b ? X b 5 p 2 X X
d d
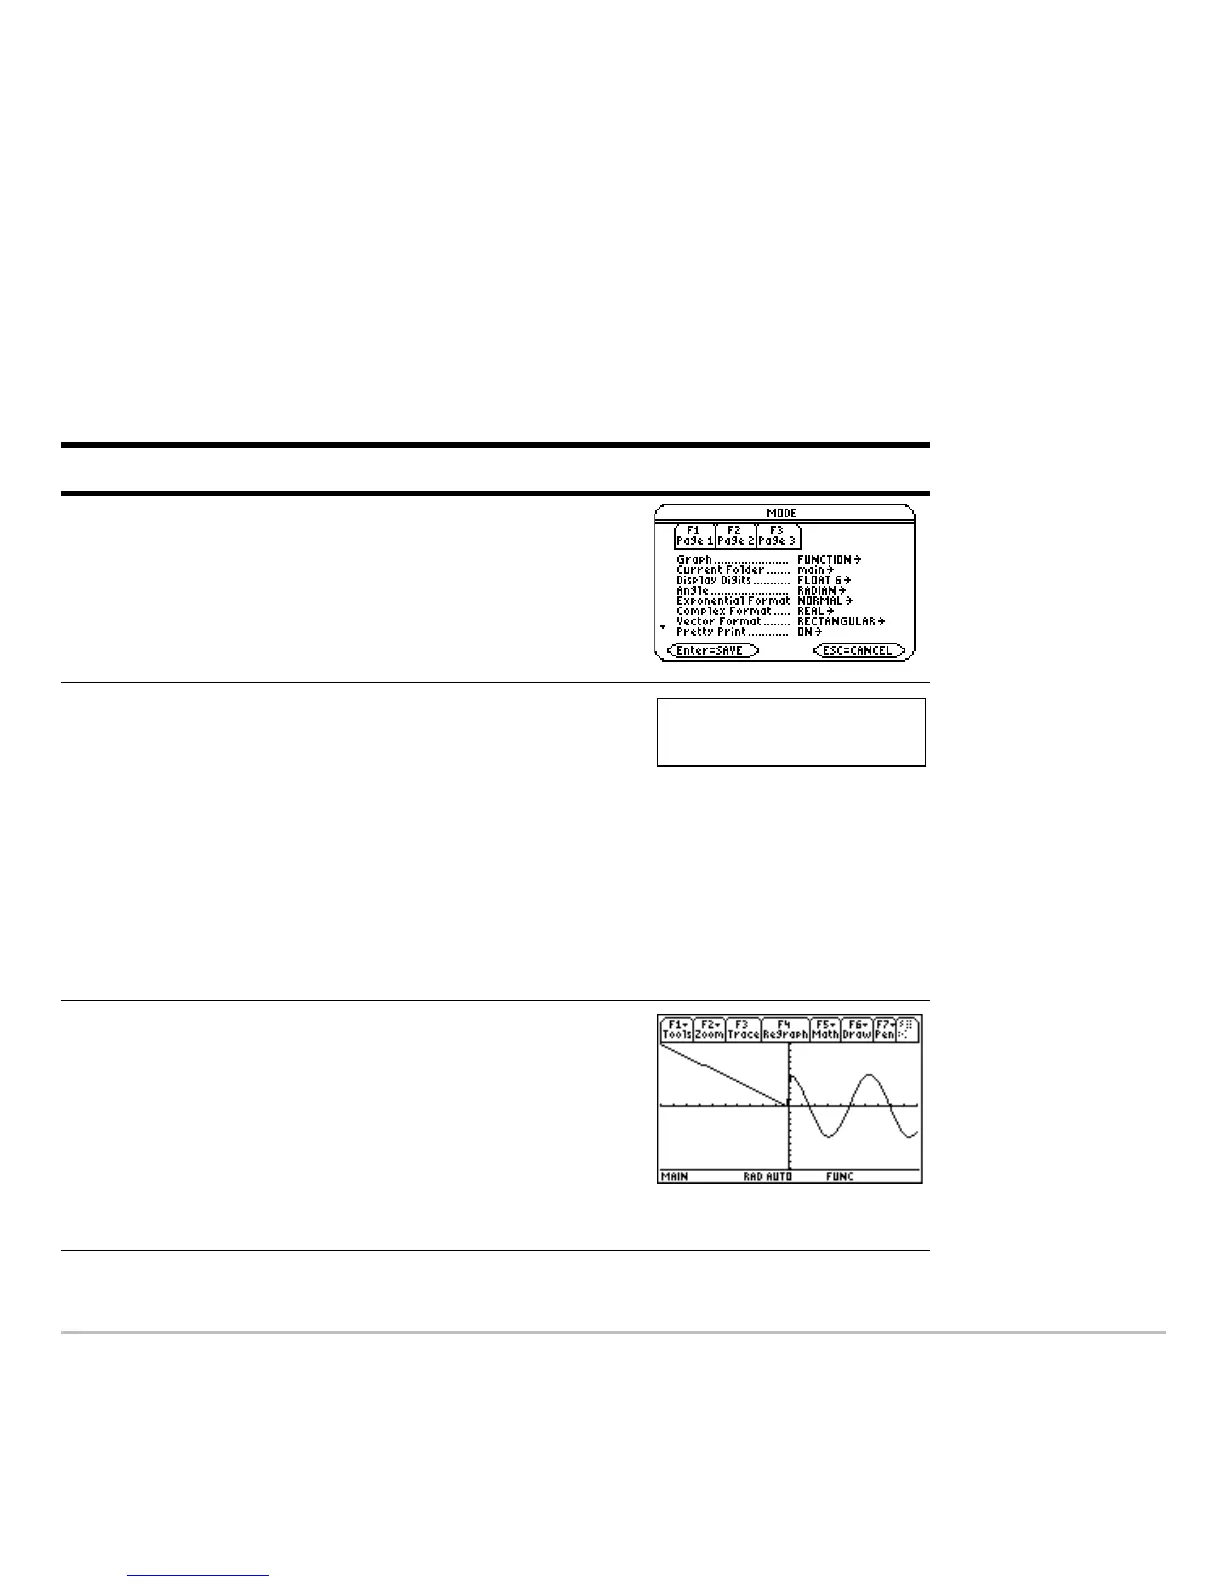
3. Execute the
Graph command, which
automatically displays the Graph screen.
The graph uses the current Window
variables, which are assumed to be their
standard values („
6) for this example.
Press ¸
Graph when(x<0,Lx,
5
…cos(x))

 Loading...