3D Graphing 397
Selecting the Graph Format Style
Selecting the Graph Format StyleSelecting the Graph Format Style
Selecting the Graph Format Style
In 3D graphing mode, define an equation and graph it as you would any 3D equation,
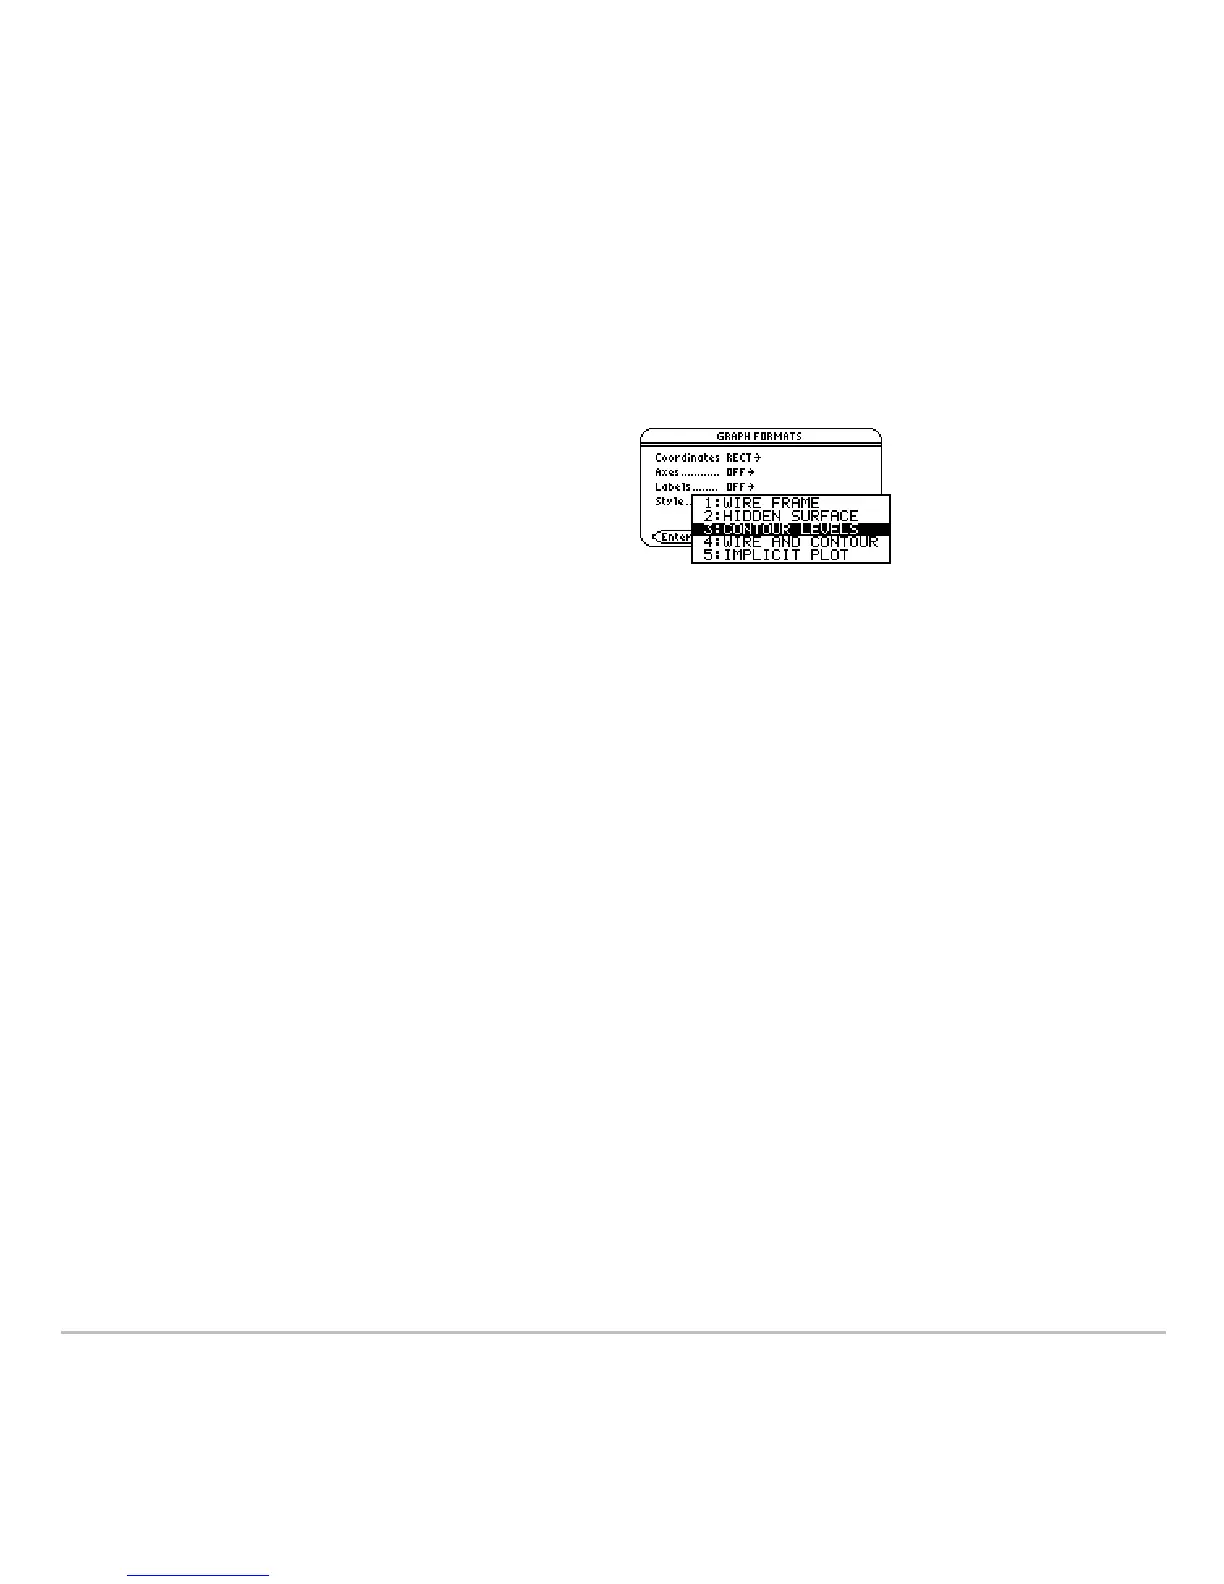
with the following exception. Display the GRAPH FORMATS dialog box by pressing ƒ
9
from the Y= Editor, Window editor, or Graph screen. Then set:
• For CONTOUR LEVELS, only the contours are shown.
- The viewing angle is set initially so that you are viewing the contours by looking
down the z axis. You can change the viewing angle as necessary.
- The graph is shown in expanded view. To switch between expanded and normal
view, press p.
- The Labels format is set to OFF automatically.
• For WIRE AND CONTOUR, the contours are drawn on a wire frame view. The
viewing angle, view (expanded or normal), and Labels format retain their previous
settings.
Notes:
• From the Graph screen, you can switch from one graph format style to the next
(skipping IMPLICIT PLOT) by pressing:
Í
•Pressing:
Í
to select CONTOUR LEVELS does not affect the viewing angle, view, or Labels
Style = CONTOUR LEVELS
– or –
Style = WIRE AND CONTOUR