Basic Function Graphing 338
3. Set the lower bound for x. Either use A and B to move the cursor to the lower bound
or type its x value.
Note: If you do not press A or B, or type an x value when setting the lower and
upper bound,
xmin and xmax will be used as the lower and upper bound,
respectively.
4. Press ¸. A 4 at the top of the screen marks the lower bound.
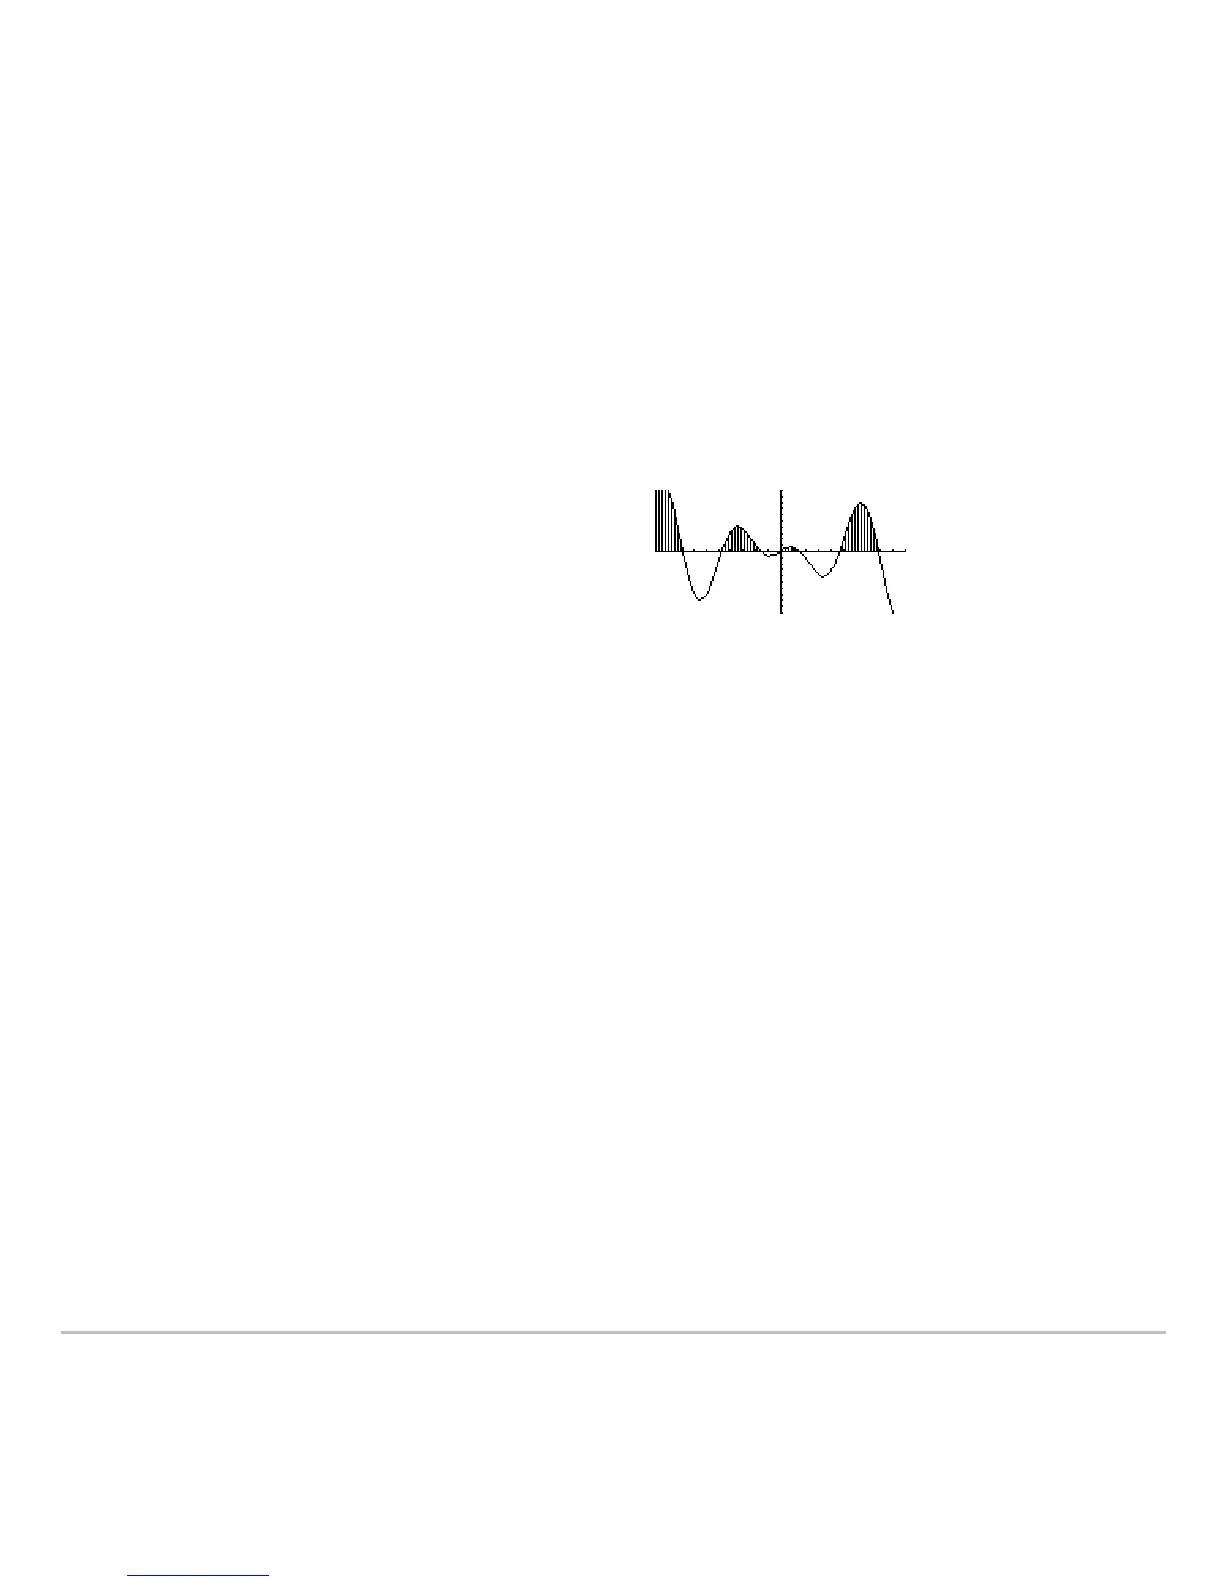
Shading the Area between Two Functions within an Interval
Shading the Area between Two Functions within an IntervalShading the Area between Two Functions within an Interval
Shading the Area between Two Functions within an Interval
You must have at least two functions graphed. If you graph only one function, the Shade
tool shades the area between the function and the x axis.
1. From the
Graph screen, press ‡ and select C:Shade. The screen prompts for
Above?
2. As necessary, use D or C to select a function. (Shading will be above this function.)
3. Press ¸. The cursor moves to the next graphed function, and the screen
prompts for
Below?
4. As necessary, use D or C to select another function. (Shading will be below this
function.)
5. Press ¸.
5. Set the upper bound, and press ¸.
The bounded area is shaded. To erase
the shaded area, press † (
ReGraph).

 Loading...