Sequence Graphing 361
With TIME axes (from Axes on the Y= Editor), you can set plotstrt = 1 and still graph only
a selected part of the sequence. Simply define a viewing window that shows only the
area of the coordinate plane you want to view.
Changing the Graph Format
Changing the Graph FormatChanging the Graph Format
Changing the Graph Format
The Graph Order format is not available.
• With TIME or CUSTOM axes, multiple sequences are always plotted simultaneously.
• With WEB axes, multiple sequences are always plotted sequentially.
Exploring a Graph
Exploring a GraphExploring a Graph
Exploring a Graph
As in function graphing, you can explore a graph by using the following tools. Any
displayed coordinates are shown in rectangular or polar form as set in the graph format.
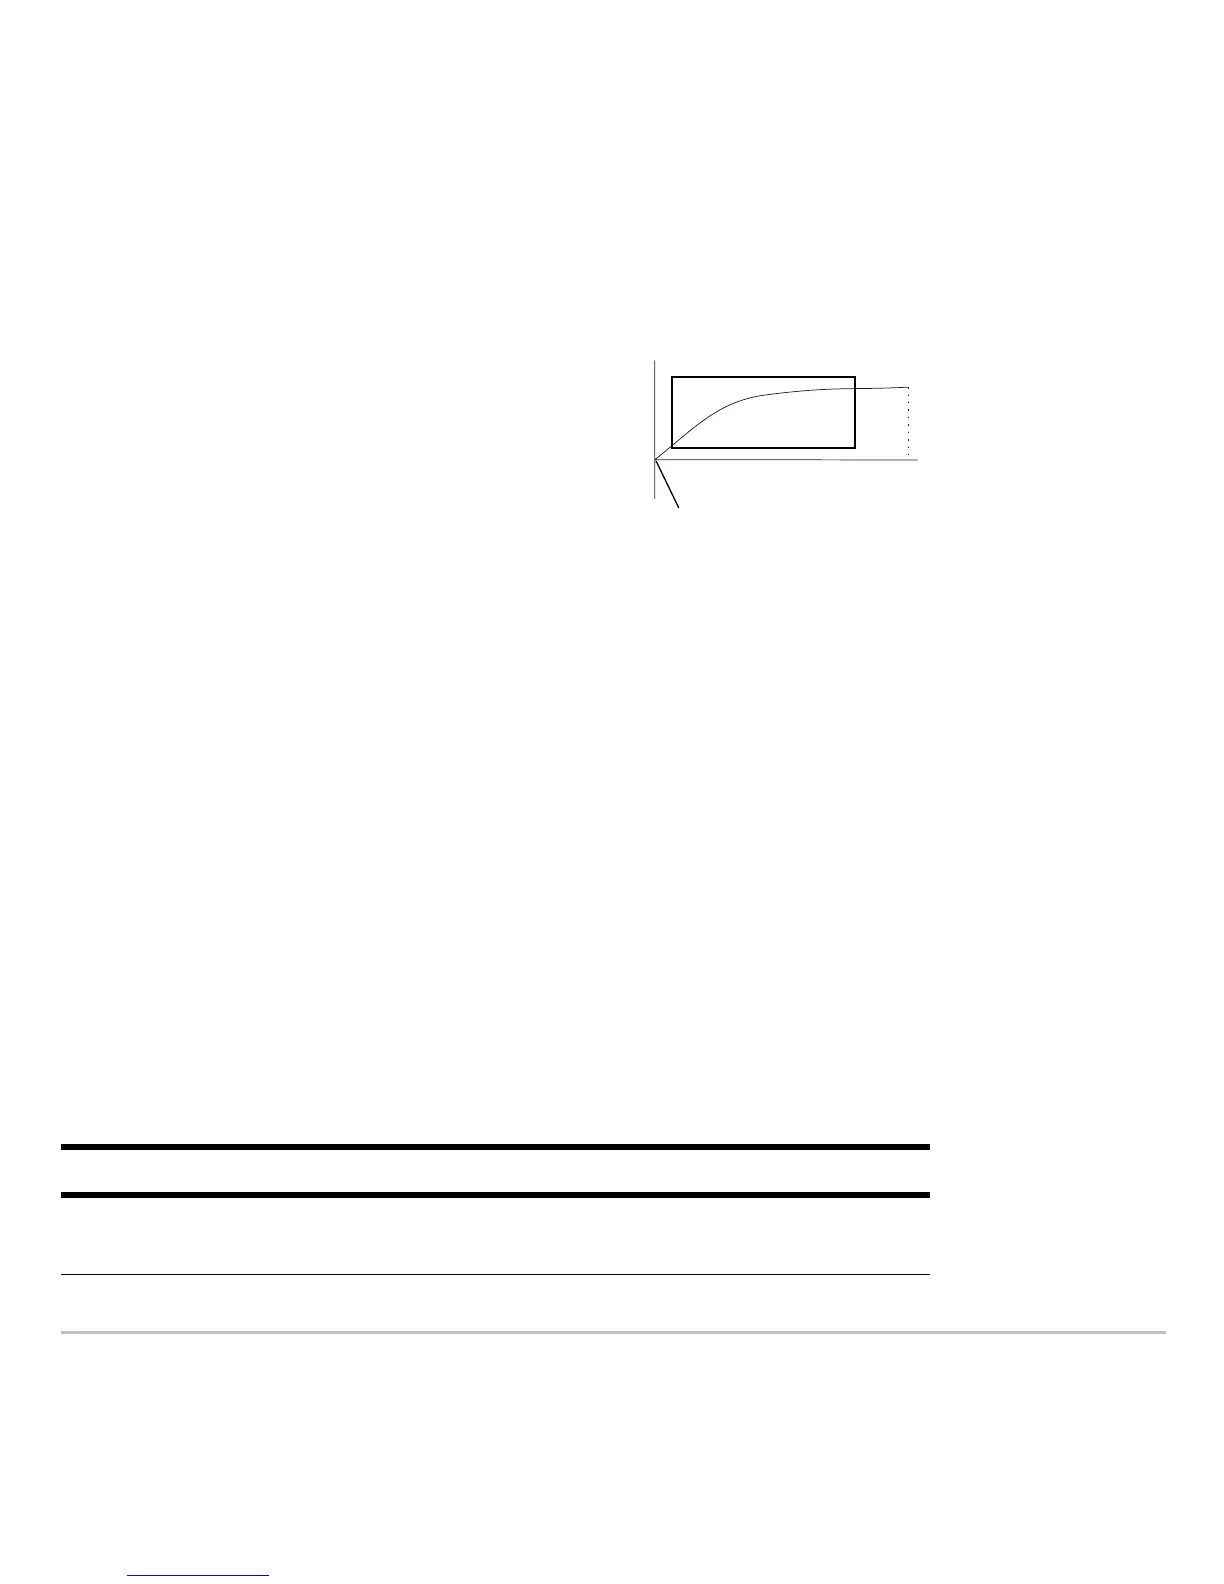
You could set:
•
xmin = first n value to graph
•
xmax = nmax (although you can use other
values)
•
ymin and ymax = expected values for the
sequence
Tool For Sequence Graphs:
Free-Moving
Cursor
Works just as it does for function graphs.
plotStrt= nma

 Loading...