38 User Guide
gases or channel data whose history has been recorded.
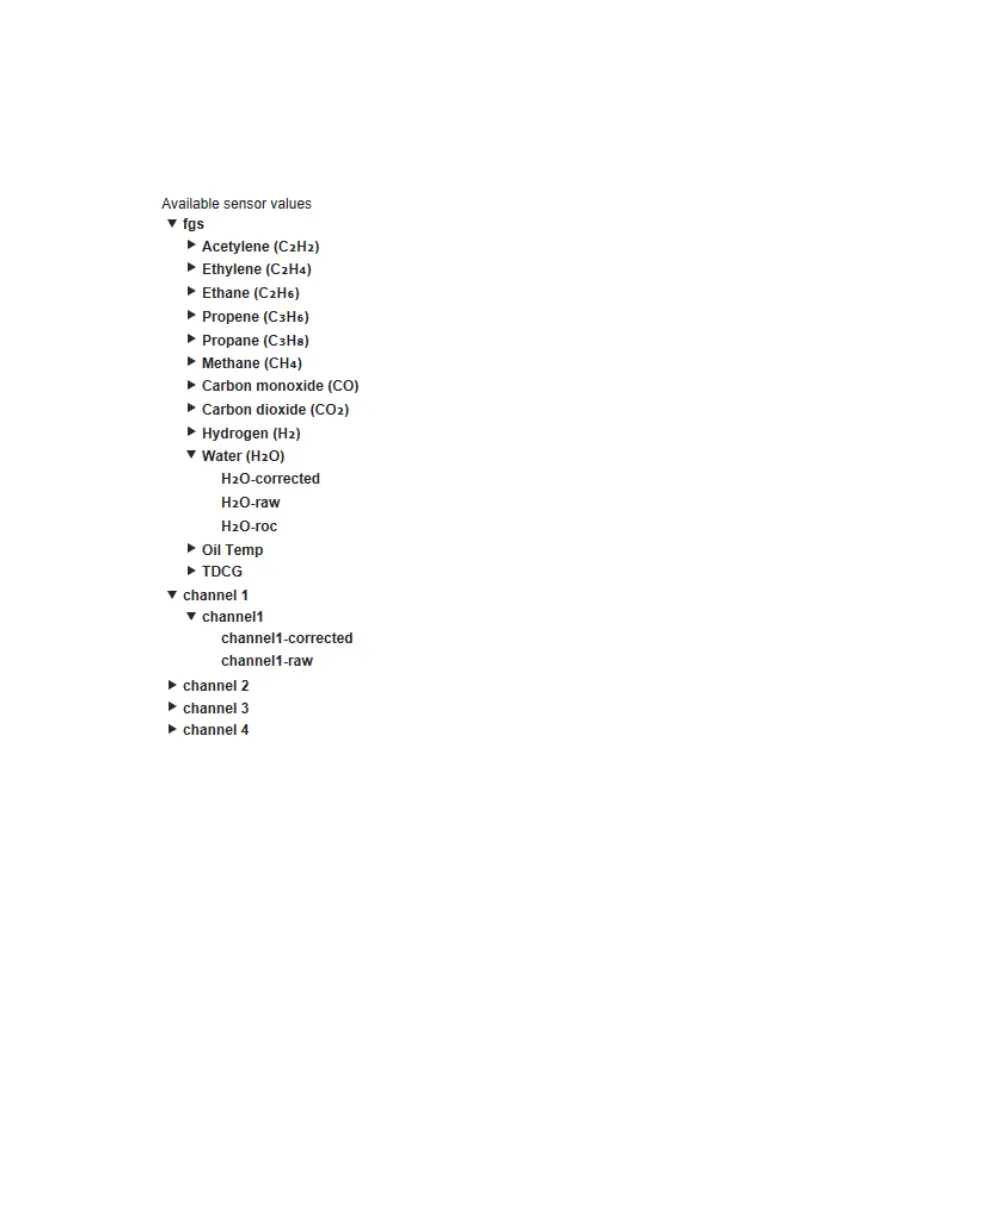
3 Click the arrow next to a gas or channel whose history you want to display (see Figure 39). This
opens up a list of available data for this specific gas or channel.
—
Figure 39 Available history data
Three types of data are recorded continuously:
– Raw data (-raw) is data as recorded directly from the sensor, without any slope and offset value
processing applied.
– Processed data (-corrected) is raw data to which slope and offset values have been applied.
– Rate of change (-roc) is the rate at which data changes over time; it is calculated over a 24-hour
period (only available for the fgs).
4 Select the data type that you wish to display. Once selected, the relevant data is displayed in the
adjacent graph.
Selecting a specific time period
Once you have selected the data type to display, you can select to display data for a specific time period
only.
To do so, from the active drop-down list above the graph, select a predefined time period. The history
graph underneath is updated to reflect the selected time period.
 Loading...