15.11Tideinformation
Animatedtideinformation
Theelectronicchartsmayallowanimationofthetideinformation
tidestations.
Animatedtideinformationisavailableinthechartapplication
whereveradiamond-shapedsymbolwitha"T"isdisplayed:
Thissymbolidentiestidestationsandtheavailabilityoftide
informationforthelocation.
Whenyouselectatidestationsymbolthechartcontextmenuis
displayed,whichprovidestheAnimateoption.
WhenyouselectAnimatetheanimatemenuisdisplayedand
thediamond–shapedsymbolsarereplacedwithdynamictide
barwhichindicatesthepredictedtideheightfortheactualtime
anddate:
Tideanimation.
•Tideheightisindicatedbyagauge.Thegaugeiscomprised
of8levels,whicharesetaccordingtotheabsoluteminimum/
maximumvaluesofthatparticularday.
•Thecolorofthearrowonthetidegaugesindicateschanges
inthetideheight:
–Red:increasingtideheight.
–Blue:decreasingtideheight.
Theanimationcanbeviewedcontinuouslyorincrementallyata
timeintervalthatyouspecify.Youcanalsosetthedateforthe
animation,andstartorrestarttheanimationatanypointwithin
a24-hourperiod.Ifthesystemdoesnothaveavaliddateand
timethedateusedwillbemiddayforthesystemdefaultdate.
Note:Notallelectronicchartssupporttheanimatedtides
feature.ChecktheNavionicswebsite:www.navionics.comto
ensurethefeaturesareavailableonyourchosencartography
level.
Viewinganimatedtideinformation
Fromthechartapplication:
1.Selectdiamond-shapedtideicon.
Thechartcontextmenuisdisplayed.
2.SelectAnimate.
Theanimatemenuisdisplayedandthetideiconisreplaced
withadynamictidebarindicator.
Controllinganimations
Fromthechartapplication,withtheanimatemenudisplayed:
1.T ostartorstoptheanimation,selectAnimate:toswitch
betweenPlayandPause.
2.T oviewtheanimationinsteps,selectStepBackorStep
Forward.
3.T osettheanimationstepinterval,pauseanyplaying
animations,andthenselectSetTimeInterval.
4.T osettheanimationdate,selectSetDateandthenusingthe
onscreenkeyboardentertherequireddate.
5.T osettheanimationdatetothecurrentdateselectToday.
6.T osettheanimationdateto24hoursprevioustothecurrent
dateselectPreviousDay.
7.T osettheanimationdateto24hoursaheadofthecurrent
dateselectNextDay.
Displayingdetailsoftides
Fromthechartapplication:
1.Selectdiamond-shapedtideicon.
Thechartcontextmenuisdisplayed.
2.SelectTideStation.
Thetidegraphfortheselectedtidestationisdisplayed.
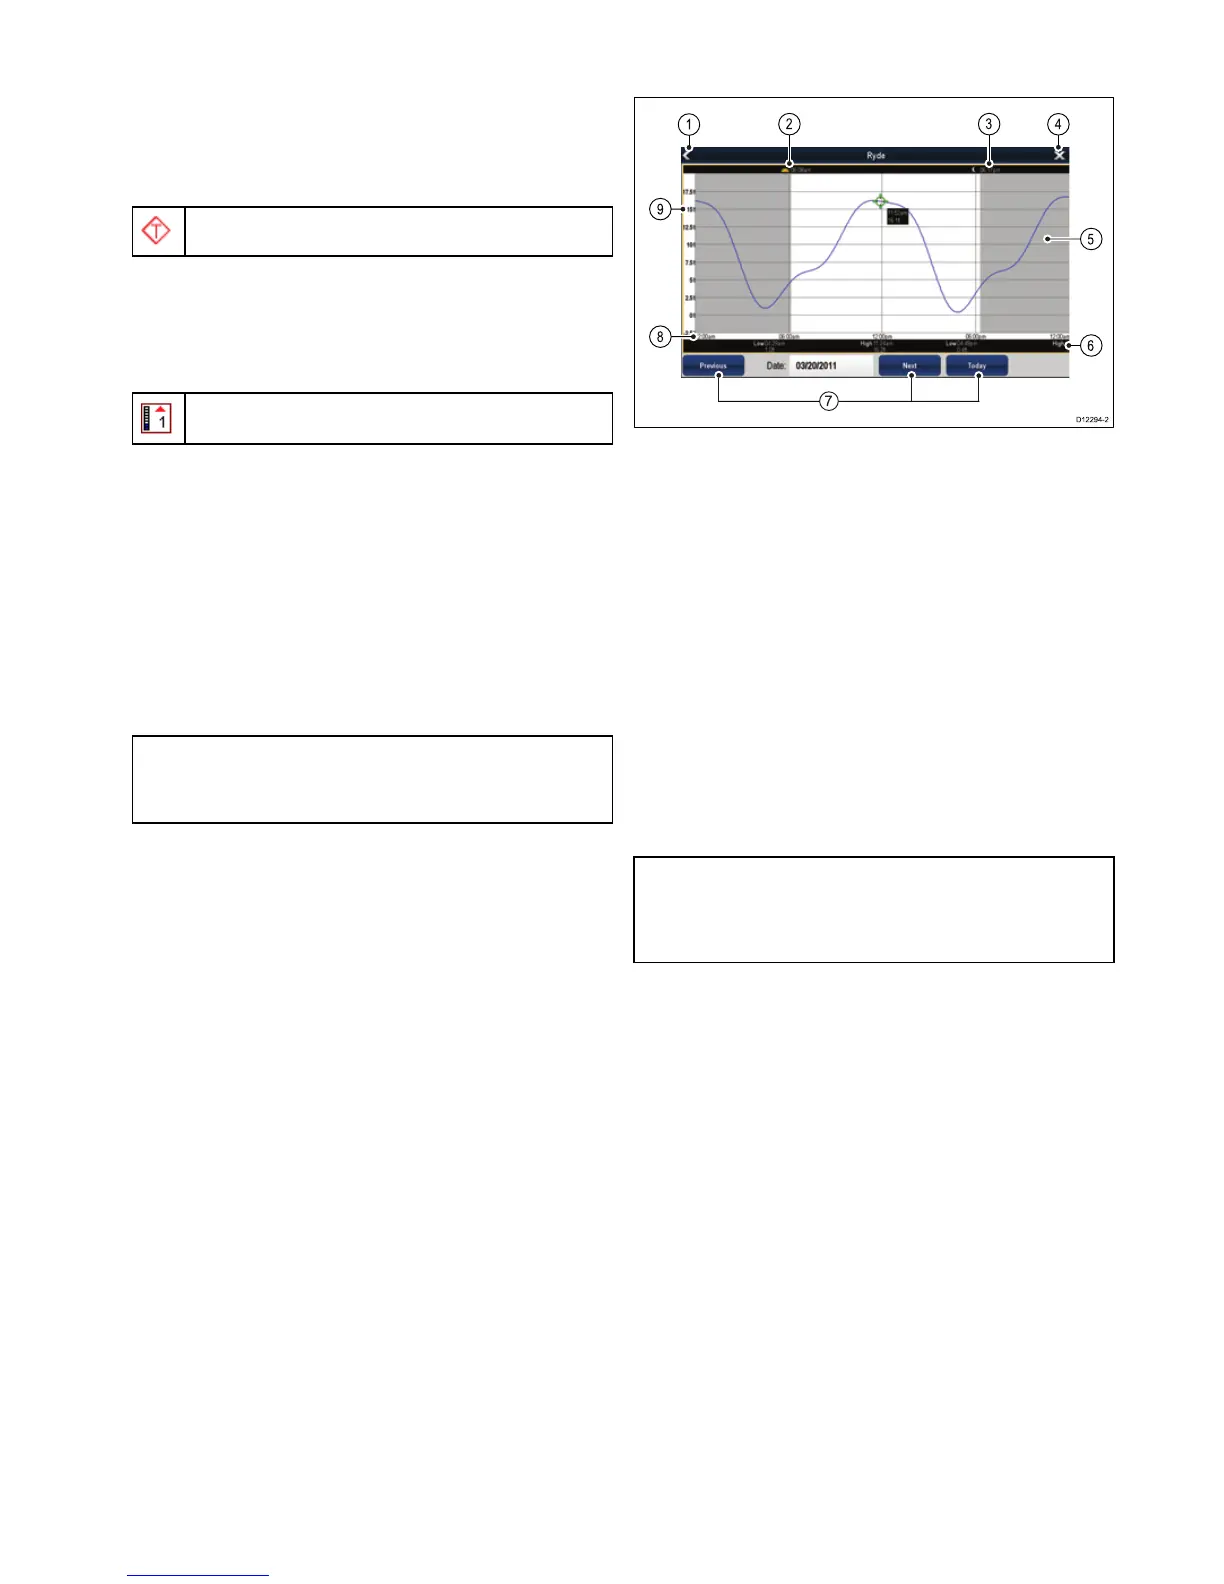
Tidegraphs
Tidegraphsprovideagraphicalviewoftidalactivity.
1.Back—returntothepreviousmenuorview.
2.Sunriseindicator—indicateswhenthesunrises.
3.Sunsetindicator—indicateswhenthesunsets.
4.Exit—closesthedialog.
5.Nightfallindicator—thegreyed-outsectionofthegraph
indicateswhennightfalloccurs.
6.Low/HighTide—Indicatesthetimeatwhichloworhigh
tideoccurs.
7.Datenavigation—Usetheiconstomovetothenextor
previousday.
8.Time—Thehorizontalaxisofthegraphindicatestime,in
accordancewiththetimeformatspeciedintheSystem
Settings.
9.Depth—Theverticalaxisofthegraphindicatestidalwater
depth.Theunitsforthedepthmeasurementarebasedon
thosespeciedintheHomescreen>Customize>Units
Set-up>DepthUnitsmenu.
Note:Thedataprovidedinthetidegraphsisforinformation
purposesonlyandshouldNOTberelieduponasasubstitute
forprudentnavigation.Onlyofcialgovernmentchartsand
noticestomarinerscontainallthecurrentinformationneeded
forsafenavigation.Alwaysmaintainapermanentwatch.
Chartapplication
149
 Loading...