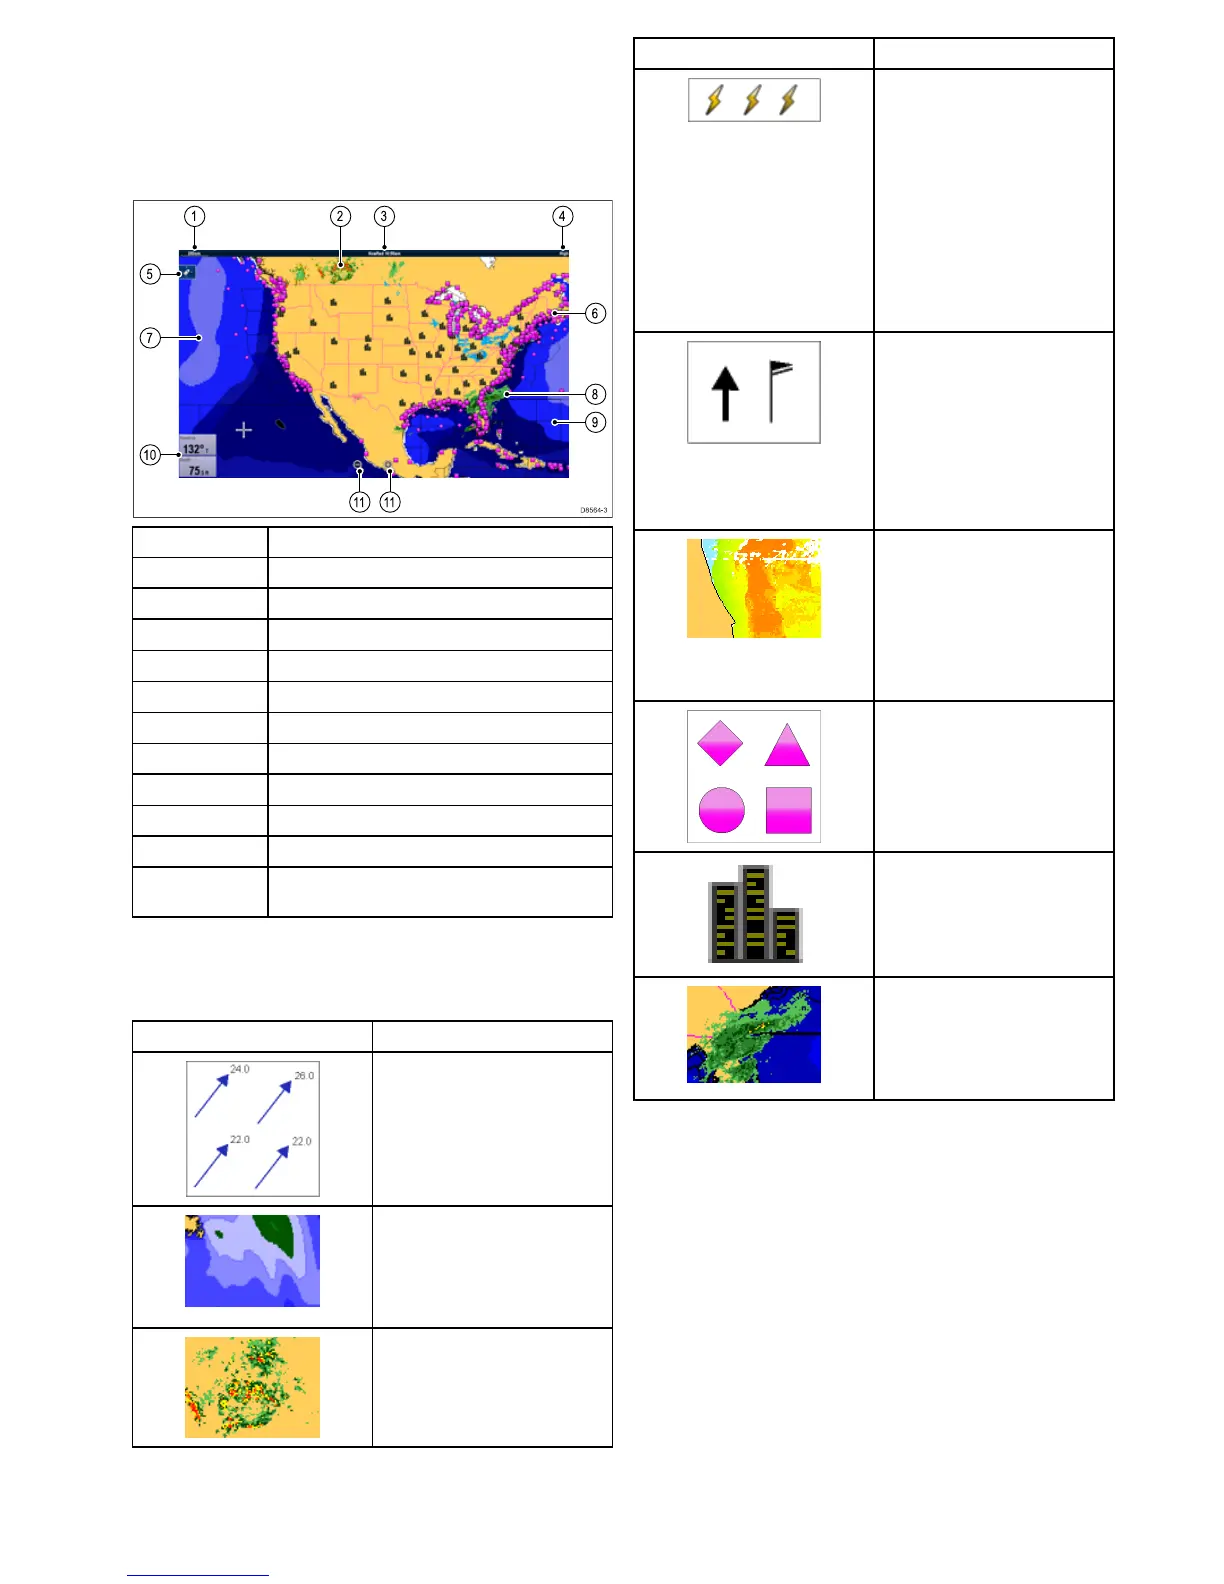
ItemDescription
1Range
2
Canadianradar
3
Animationandtime/date
4
Signalstrength
5
Findshipicon
6
Surfaceobservationstations
7
Waveheights
8
NOWRad
9Marinezones
10Dataoverlaycells
11
On-screenRangeinandouticons(T ouchscreen
displaysonly)
Weathersymbols
Theweatherapplicationusesarangeofgraphicsandsymbols
torepresentdifferentweatherconditionsandforecasts.
SymbolDescription
Stormcast(darkblue)arrows
indicatingdirectionandspeedofa
storm.
Waveheight
•Highestwaves(red)
•Intermediatewaves(greens)
•Lowestwaves(blues)
Canadianradar(darkgreens,
yellow,orangeandred)
SymbolDescription
Lightning—alightningsymbolis
shownateachcloud-to-ground
strike:
•Light(recordedinlast10–15
minutes.)
•Medium(recordedinlast5–10
minutes.)
•Dark(recordedinlast0–5
minutes.)
Morerecentstrikesareoverlaid
overoldersymbols.
Wind—Windsymbolsshowthe
currentwinddirectionandstrength
andcanbedisplayedaseither
anarroworawindbarb.Wind
arrowsindicatespeed—thelarger
thearrow,thegreater(stronger)
thewindspeed.Windbarbsgive
amorepreciseindicationofwind
speedasshowninthewindspeed
symbolssection.
Seasurfacetemperature(green,
yellowandorange)
•Blue—coldest
•green
•yellow
•orangeandred—warmest
Surfaceobservationstations(pink)
—Currentorhistoricalweather
datacanbeviewedatsurface
observationstations.Notalldatais
availableforallstations.
Cities—Thecitysymbolsenables
youtoaccessdetailsofcityweather
forecasts.Upto3forecastsare
displayedforeachcity.
NOWRad
•Rain(green,yellowandred.)
•Snow(blues)
•Mixture(pinks)
Stormtrackingsymbols
Theweatherapplicationusesarangeofsymbolstorepresent
differenttypesofstormtracks.Thestormtrackingfunction
enablesyoutomonitorsignicantstormsinthearea.
Examplesofsignicantstormsincludetropicaldisturbances,
depressions,stormsandcyclones,hurricanes,typhoons,and
supertyphoons.
Theweathermapdisplaysthetrackthatthestormhastaken,its
currentandforecastedposition,thewindradii(currentposition
only),direction,andspeedoftravel.
Stormtracksarehighlightedontheweathermapintheform
ofsymbols,asshownbelow.
Weatherapplication(NorthAmericaonly)
251
 Loading...