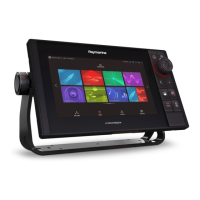
Historical
(grey)Current(red)
Forecast
(orange)Description
Hurricane
(Category1–5)
Tropicalstorm
Tropical
disturbance,
tropical
depression
Whenasymbolisselected,additionalstorminformationcanbe
accessedbythecontextmenu:
•Storm'snameandtype.
•Dateandtime.
•Position,directionandspeed.
•Pressureandmaximumwindspeedandgusts.
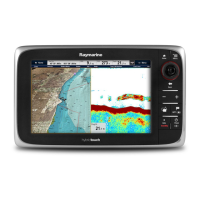
Surfacepressuresymbols
Theweatherapplicationusesarangeofsymbolstorepresent
differentsurfacepressureconditions.
SymbolDescription
High/lowpressure(blueandred)
Warmfront(red)
Coldfront(blue)
Occludedfront(purple)
Stationaryfront(red-blue)
Trough(brown)
Squallline(red)
Dryline(red)
Isobars(grey)
Surfaceobservationstationsymbols
Theweatherapplicationusesarangeofsymbolstorepresent
differenttypesofsurfaceobservationstation.
SymbolDescription
Buoystation
C-MAN(Coastal-marineautomated
network)
WSI(Weatherservicesinternational)
NWS(Nationalweatherservice)
Windspeedsymbols
Theweatherapplicationusesarangeofsymbolstorepresent
differentwindspeeds.
SymbolSpeedSymbolSpeedSymbolSpeed
3–7kts8–12kts13–17kts
18–22kts23–27kts28–32kts
33–37kts38–42kts43–47kts
48–52kts53–57kts58–62kts
63–67kts68–72kts73–77kts
78–82kts83–87kts88–92kts
93–97kts98–102
kts
etc.
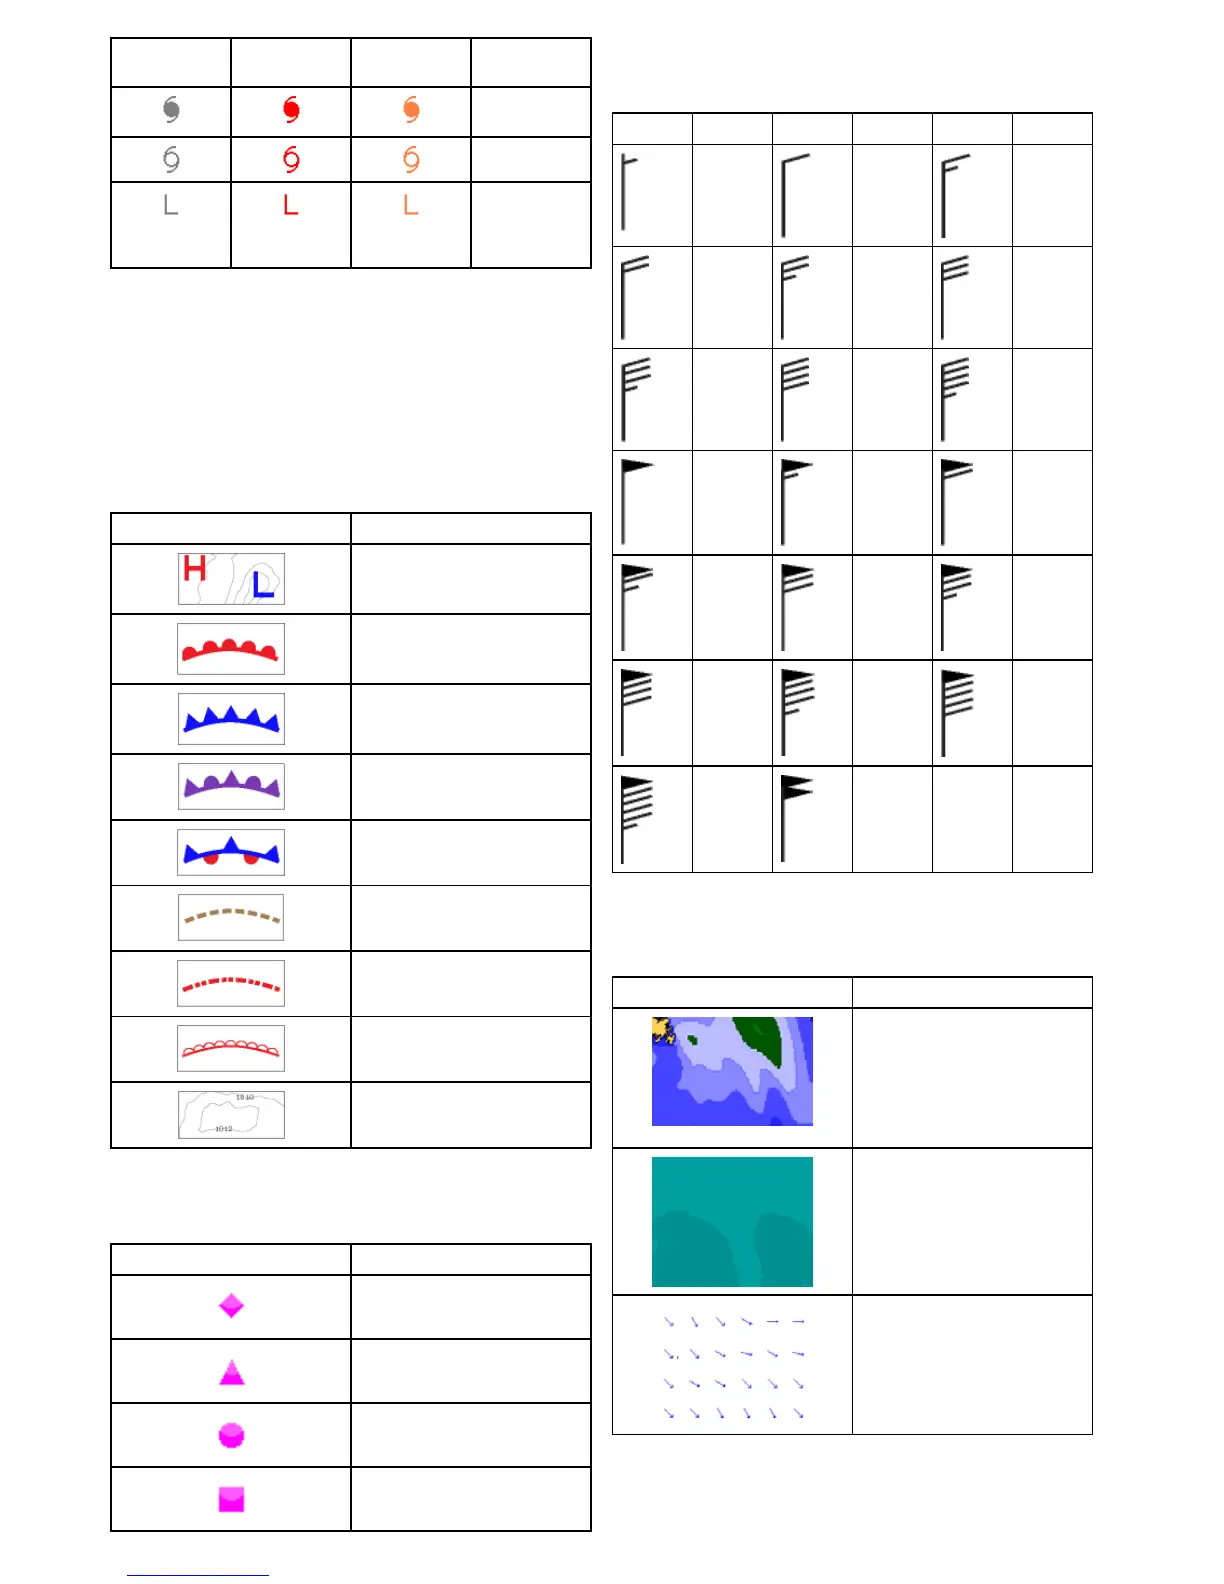
Waveinformationsymbols
Theweatherapplicationusesarangeofgraphicsandsymbols
torepresentdifferenttypesofwaveinformation.
SymbolDescription
Waveheight—Wavesareshownin
16shadesofcolorfrom:
•Reds—Highestwaves
•Greens—Intermediatewaves
•Blues—Lowestwaves
Waveperiod—waveperiodsare
shownusingshadesofblue,the
darkertheshadetheshortergap
betweensuccessivewaves.The
waveperioddetailcanbeaccessed
bythecontextmenuViewData
option.
Wavedirection—directionofwaves
isindicatedbybluearrows.
252NewaSeries/NewcSeries/NeweSeries
 Loading...