TI-83, TI-83 Plus, TI-84 Plus Guide
You can obtain an
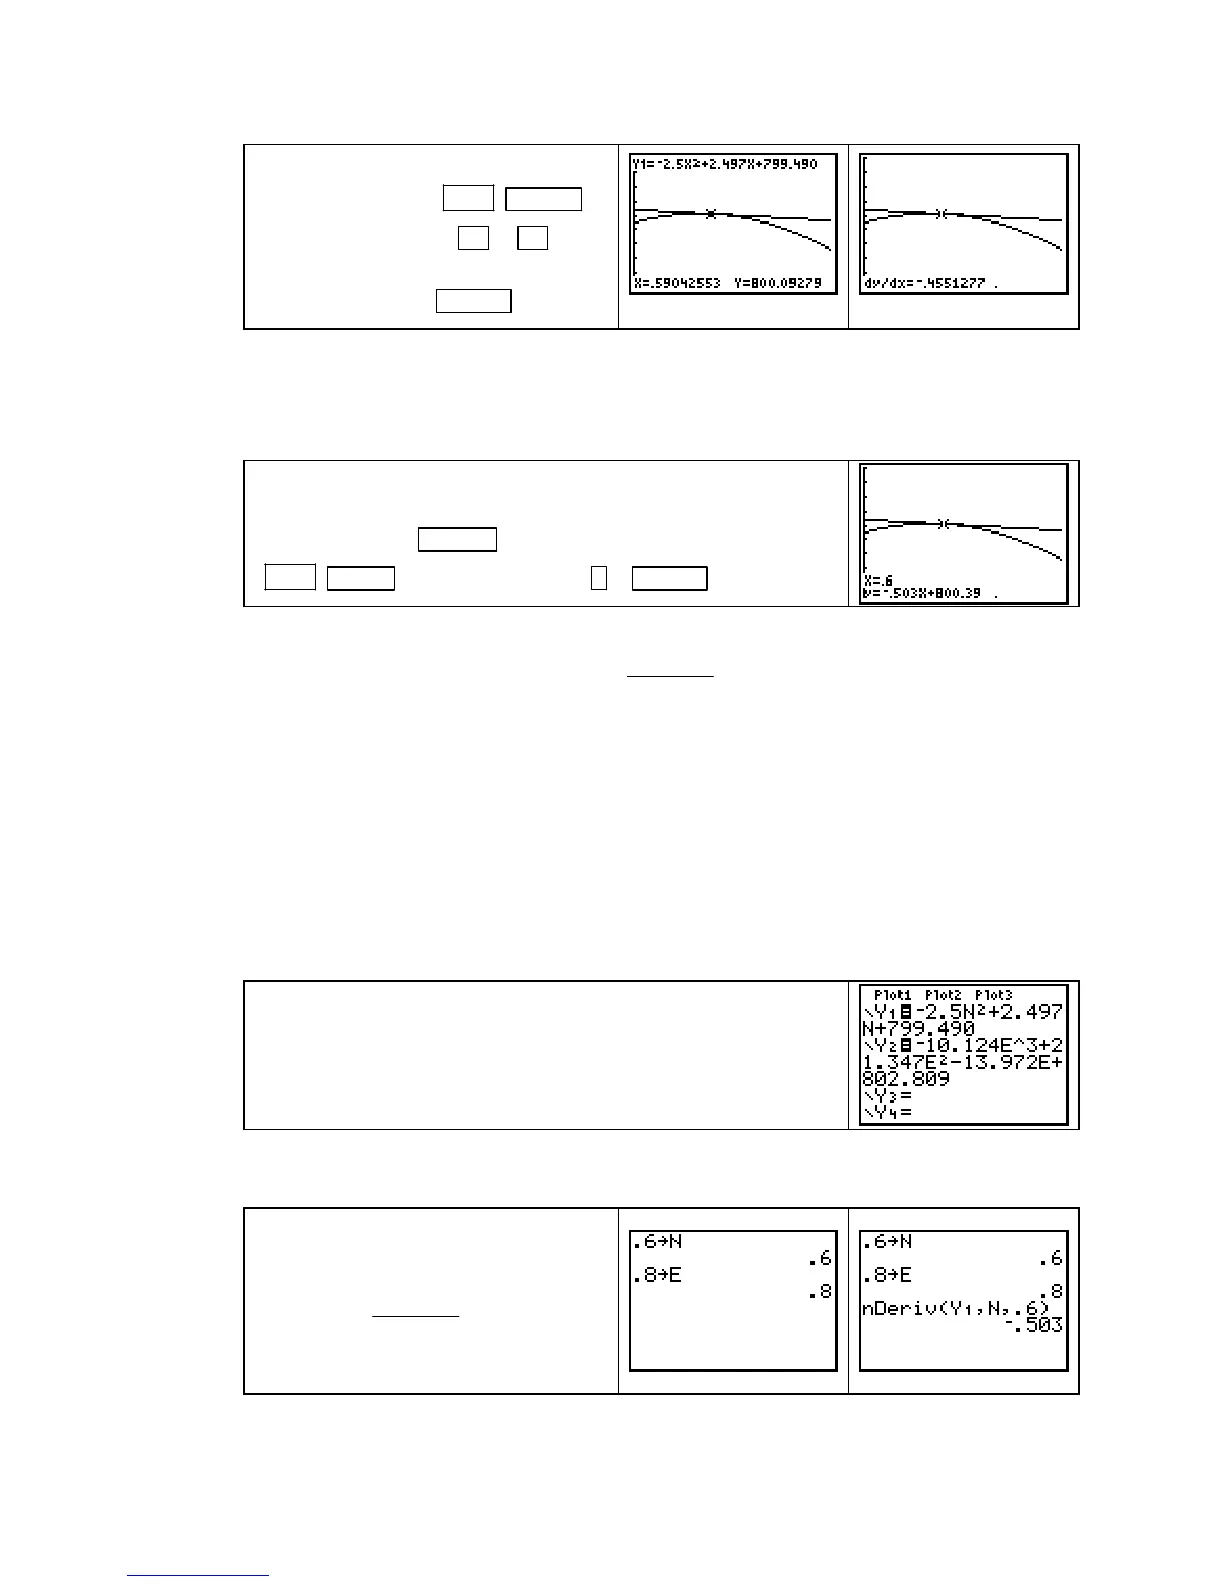
estimate of the tan-
gent line slope with
2ND TRACE
(CALC) 6 [dy/dx].
Use ► or ◄ to
move the cursor as close as possible to
n = X = 0.6. Press ENTER .
0.6 is not a trace value.
This is just an estimate.
We could have obtained a much better estimate than the one given above if we had found the
slope of the tangent line at
X = 0.6 rather than a value close to that number. The calculator
allows you to do this on the home screen or graphically. Here we illustrate the graphical
method.
Have E(0.8, n), using X as the input variable, in Y1. Draw the
tangent line to
E(0.8, n) at n = 0.6 by first drawing the graph of
the function with
GRAPH . With the graph on the screen, press
2ND PRGM (DRAW) 5 [Tangent(] . 6 ENTER .
Because this method gives the equation of the line tangent to the graph at the chosen input,
you can see that the slope of the tangent,
dE n
dn
( )08.,
at n = 0.6, is about
−
0.503 foot/mile.
FINDING RATES OF CHANGE USING CROSS-SECTIONAL MODELS The methods
described in the last section require that you use
X as the input variable to find rates of change.
The process of replacing other variables with
X can be confusing. You can avoid having to do
this replacement when you use the calculator numerical derivative on the home screen to
evaluate rates of change at specific input values. We illustrate with the cross-sectional function
E(e, 0.6) =
−
10.124e
3
+ 21.347e
2
– 13.972e + 802.809 feet above sea level that was found in
Section 9.2.1b of this
Guide. We also demonstrate this method with the cross-section E(0.8, n)
that was found in Section 9.2.1a and used on page 100 of this
Guide.
NOTE: Whenever possible, you should use the complete equation found by the calculator with
this method. However, to avoid re-entering the data, we use the rounded functions to illustrate.
Have E(0.8, n) =
−
2.5n
2
+ 2.497n + 799.490, using N as the input
variable, in
Y1. Enter E(e, 0.6), using E as the input variable, in
Y2.
(Remember that because we are not using
X as the input
variable, we should not draw a graph or use the
TABLE.)
NOTE: These functions could be entered on the home screen instead of in the Y= list. We
use
Y1 and Y2 in the Y= list because they are convenient locations to hold the equations.
Tell the calculator the point at which
the derivative is to be evaluated by
storing the values. Then, on the home
screen, find
dE n
dn
( 08., )
evaluated at n =
0.6 with the numerical derivative
nDeriv.
Copyright © Houghton Mifflin Company. All rights reserved.
101

 Loading...


