Chapter 4
Find the x-intercept of the second derivative graph as indicated in this section or find the input
of the high point on the first derivative graph (see page 63 of this Guide) to locate the inflection
point.
5.3.2 USING THE CALCULATOR TO FIND INFLECTION POINTS Remember that an
inflection point on the graph of a function is a point of greatest or least slope. Whenever find-
ing the second derivative of a function is tedious algebraically and/or you do not need an exact
answer from an algebraic solution, you can easily find the input location of an inflection point
by finding where the first derivative of the function has a maximum or minimum slope.
We illustrate this method using the logistic function for polio cases that is in Example 2 of
Section 5.3 in Calculus Concepts:
The number of polio cases in the U.S. in 1949 is given by C(t) =
42 183911
1 21 484 253
1 248911
,.
,.
.
+
−
e
t
where t = 1 in January, t = 2 in February, and so forth.
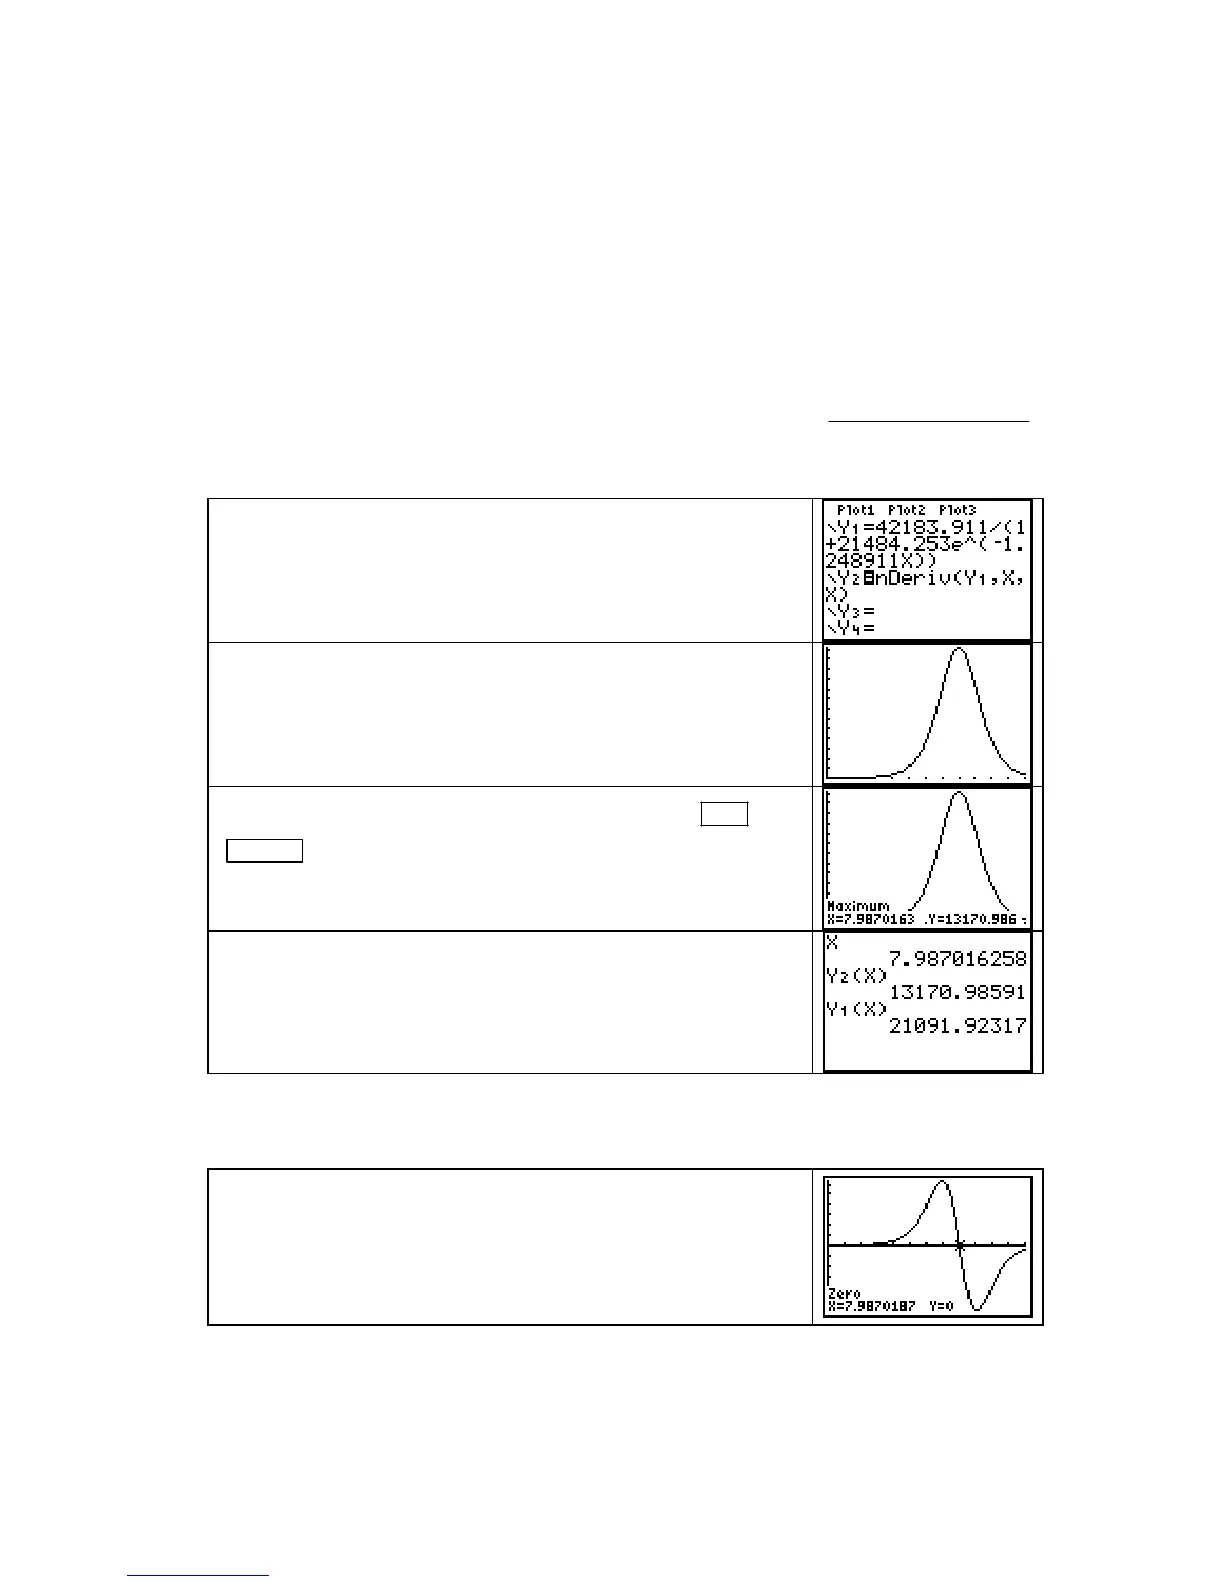
Enter C in the Y1 location of the Y= list and the first derivative
of f in
Y2. (You can use your algebraic formula for the first
derivative or the calculator’s numerical derivative.)
Turn off
Y1.
The problem context says that the input interval is from 0 (the
beginning of 1949) to 12 (the end of 1949), so set these values
for x in the
WINDOW. Set the vertical view and draw the graph
of C
′
with ZoomFit.
Use the methods discussed on page 63 of this Guide ( 2ND
TRACE
(CALC) 4 [maximum]) to find the input location of the
maximum point on the slope graph.
The x-value of the maximum of the slope graph is the x-value of
the inflection point of the function. To find the rate of change
of polio cases at this time, substitute this value of x in
Y2. To
find the number of cases at this time, substitute x in
Y1.
CAUTION: Do not forget to round your answers appropriately (this function should be
interpreted discretely) and to give units of measure with each answer.
Note that you could have found the input of the inflection point
on the polio cases graph by finding the x-intercept of the second
derivative graph.
The function that is graphed to the right is
Y3 = nDeriv(Y2, X, X),
and the graph was drawn using
ZoomFit.
Copyright © Houghton Mifflin Company. All rights reserved.
64

 Loading...


