TI-83, TI-83 Plus, TI-84 Plus Guide
Consider what is now in the lists.
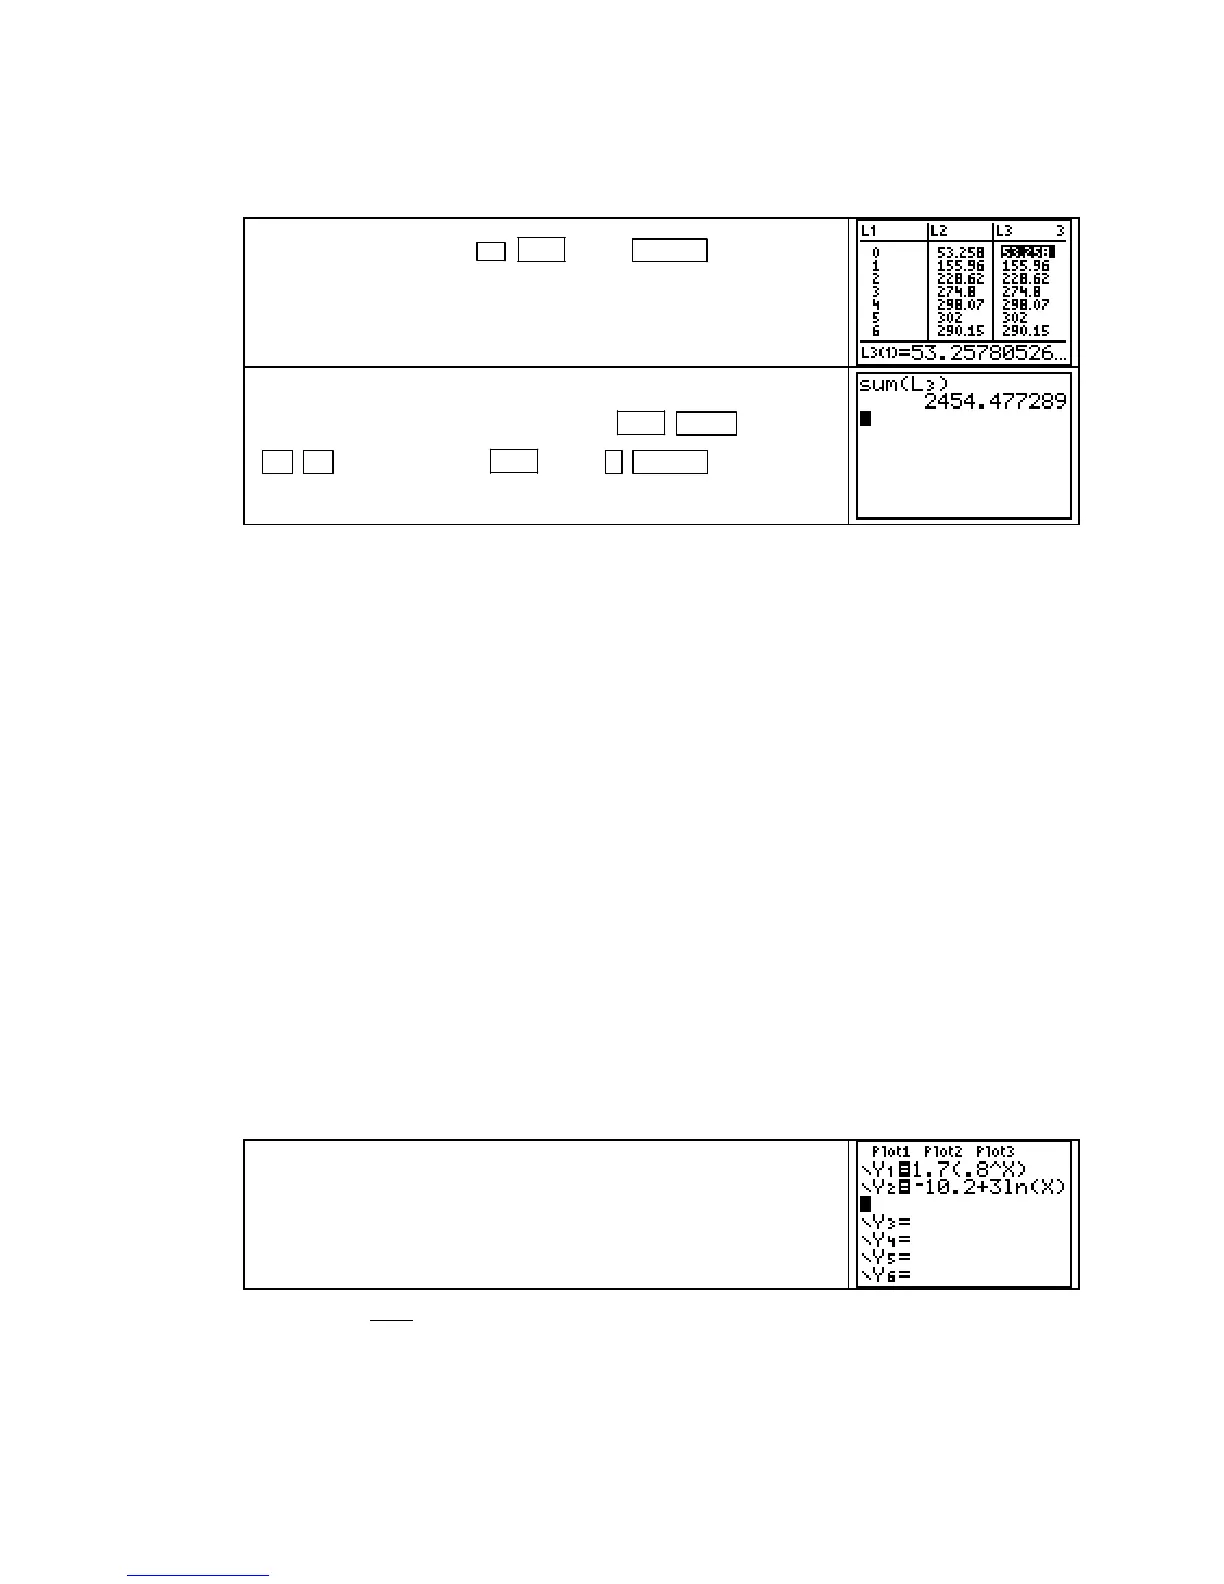
L1 contains the left endpoints of the 11 rectangles and L2
contains the heights of the rectangles. If we multiply the heights by the widths of the rectan-
gles (1 hour) and enter this product in
L3, we will have the rectangle areas in L3.
Highlight
L3 and type 1 U 2ND 2 (L2) ENTER . L3 now
contains the areas of the 11 rectangles.
All that remains is to add the areas of the 11 rectangles. To do
this, return to the home screen and type
2ND STAT (LIST)
►
► [MATH] 5 [sum] 2ND 3 (L3) ) ENTER .
We estimate that 2574 customers came to the Saturday sale.
When you use left rectangles to approximate the results of change, the rightmost data point is
not the height of a rectangle and is not used in the computation of the left-rectangle area.
Similarly, when using right rectangles to approximate the results of change, the leftmost data
point is not the height of a rectangle and is not used in the computation of the right-rectangle
area. We illustrate the right-rectangle approximation using the function r that is given in
Example 2 of Section 5.1.
The rate of change of the concentration of a drug in the bloodstream is modeled by
1.7(0.8 ) when 0 20
()
10.2 3 ln when 20 30
x
x
rt
xx
⎧
⎪
⎨
−
⎪
⎩
≤≤
=
+<≤
≤
where x is the number of days after the drug is first administered.
This function is an example of a piecewise function.
GRAPHING A PIECEWISE CONTINUOUS FUNCTION Piecewise continuous func-
tions are used throughout the text. You will need to use your calculator to graph and evaluate
outputs of piecewise continuous functions. Several methods can be used to draw the graph of
a piecewise function. One of these is presented below using the function r(t) from Example 2
of Section 5.1.
The rate of change of the concentration of a drug in the bloodstream is modeled by
1.7(0.8 ) when 0 20
()
10.2 3 ln when 20 30
x
x
rt
xx
⎧
⎪
⎨
−
⎪
⎩
≤≤
=
+<
where x is the number of days after the drug is first administered.
Clear any functions that are in the Y= list. Using X as the input
variable, enter each piece of the function in a separate location.
We use locations
Y1 and Y2.
Next, we form the formula for the piecewise function in
Y3.
Parentheses must be used around the function portions and the inequality statements that tell
the calculator which side of the break point to graph each part of the piecewise function.
Copyright © Houghton Mifflin Company. All rights reserved.
67

 Loading...


