Chapter 5
Clear lists
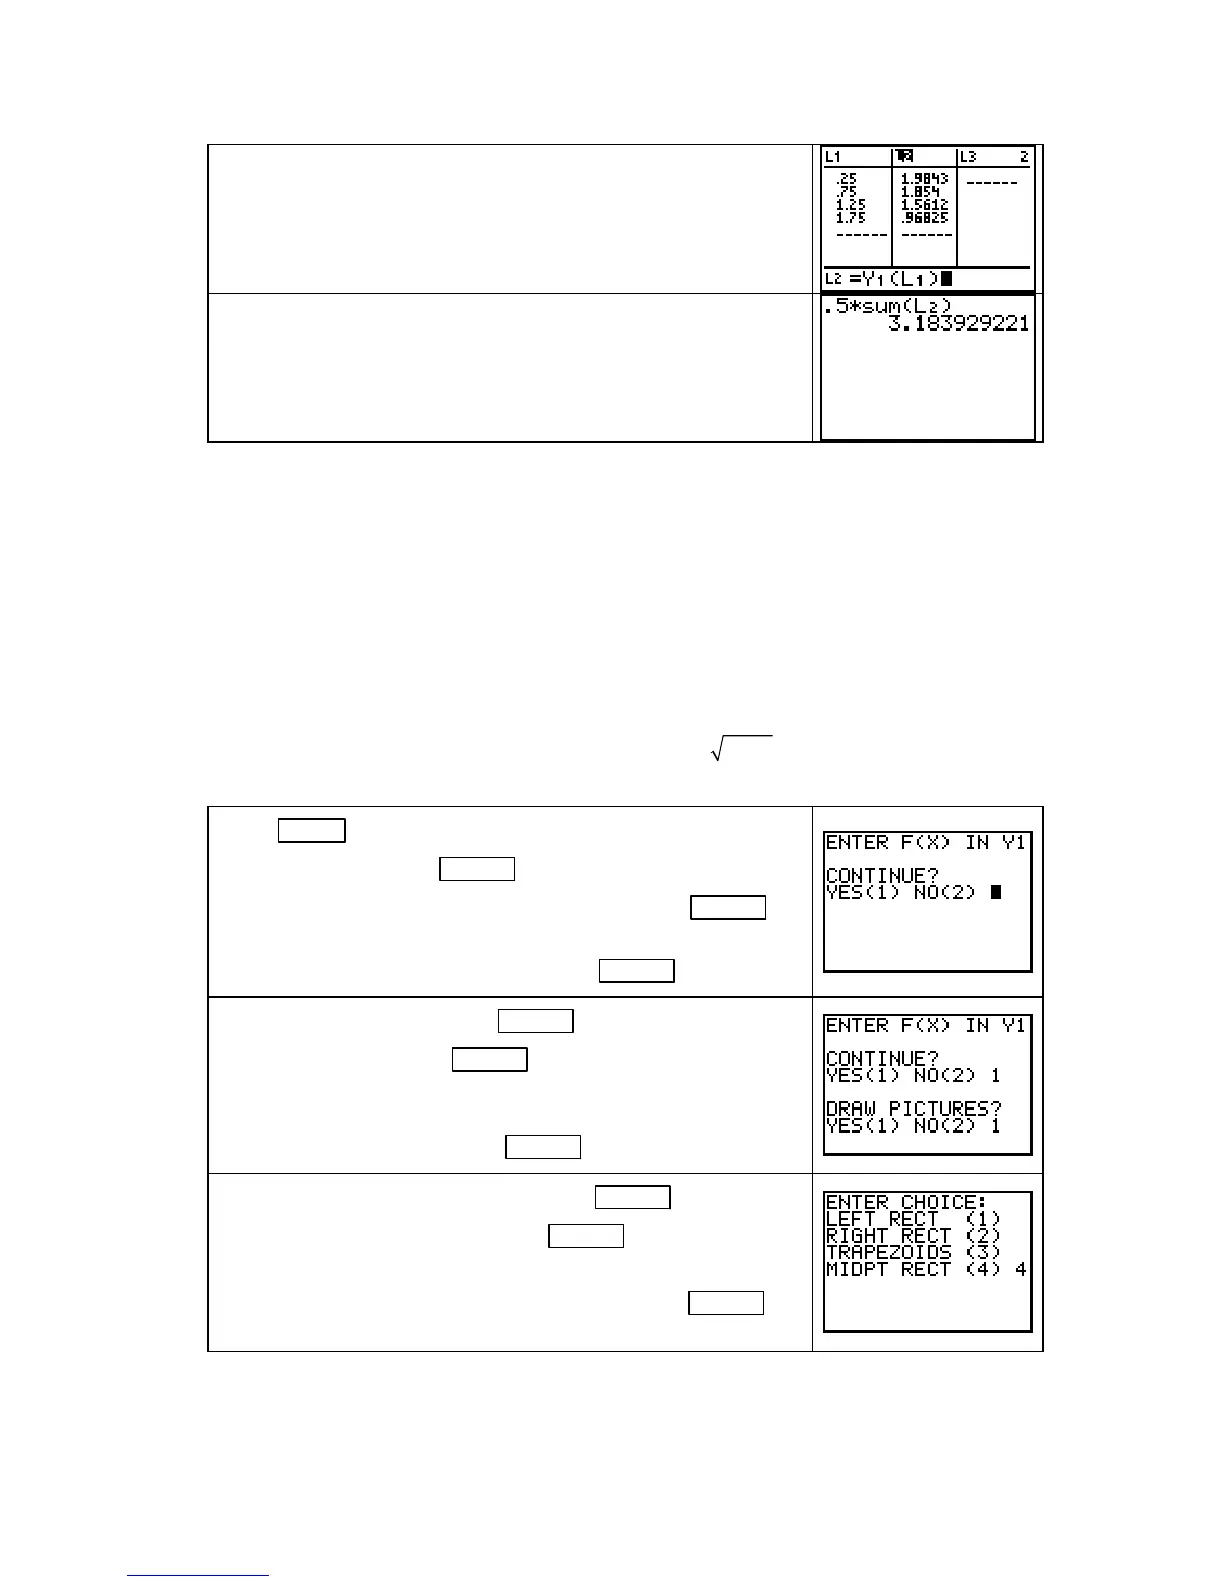
L1 and L2. To use 4 midpoint rectangles to
approximate the area of the region between the graph of f and
the x-axis between x = 0 and x = 2, first enter the midpoints of
the rectangles
(0. 25, 0. 75, 1. 25, 1. 75) in L1.
As shown to the right, enter the heights of the rectangles in
L2.
You can now multiply each rectangle height by the width 0. 5
(entering these values in another list) and sum the rectangle areas
or you can multiply the sum of the heights in
L2 by 0. 5. Either
calculation results in the area estimate.
USING THE NUMINTGL PROGRAM TO SIMPLIFY AREA APPROXIMATIONS
The procedures previously shown in this Guide to find the areas of left, right, or midpoint
rectangles can become tedious when the number of rectangles is large. When you have a
function y = f(x) in the
Y1 location of the Y= list, you will find program NUMINTGL very
helpful in determining left-rectangle, right-rectangle, and midpoint-rectangle approximations
for accumulated change. Program
NUMINTGL (available as a download at
http://college.hmco.com/mathematics/latorre/calculus_concepts/3e/students/programs.html)
performs automatically all the calculations that you have been doing manually using the lists.
WARNING: This program will not execute properly unless the function that determines the
heights uses
X as the input variable and is pasted in Y1.
We illustrate using this program with the function f
(x) =
2
4
that is used in Example 3 in
Section 5.1. This function should be entered in the
Y1 location of the Y= list.
Press PRGM followed by the number or letter next to the loca-
tion of the program and
ENTER to start NUMINTGL. (At this
point, if you did not enter the function in
Y1, press 2 ENTER to
exit the program. Enter the function in
Y1 and re-run the
program). If the function is in
Y1, press 1 ENTER to continue.
At the next prompt, pressing 1 ENTER draws the approximating
rectangles and pressing
2 ENTER obtains only numerical
approximations to the area between the function and the horizon-
tal axis between 0 and 1. For illustration purposes, let’s choose
to see the rectangles, so press
1 ENTER .
At the LEFT ENDPOINT? prompt, press 0 ENTER , and at the
RIGHT ENDPOINT? prompt, press 2 ENTER to tell the
calculator the input interval.
You are next shown a menu of choices. Press
4 and ENTER
for a midpoint-rectangle approximation.
Copyright © Houghton Mifflin Company. All rights reserved.
70