Chapter 1
Press
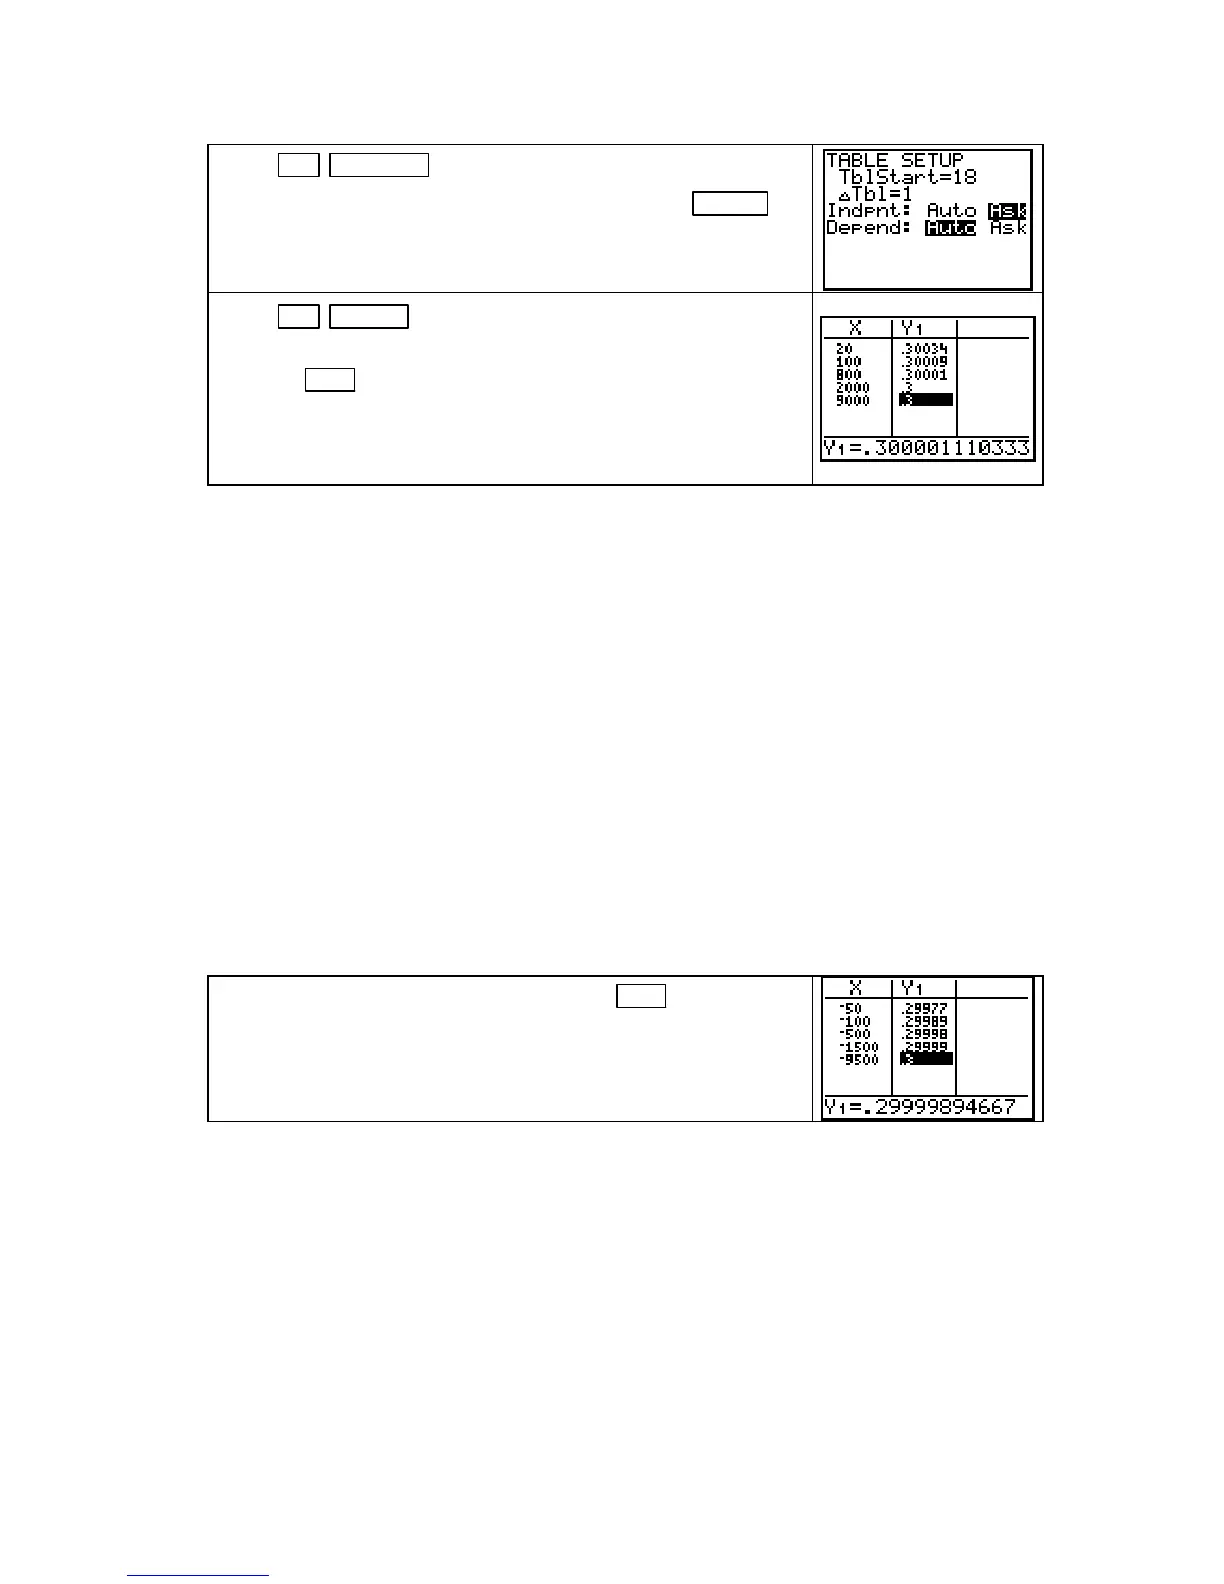
2nd WINDOW (TBLSET). Choose Ask in the Indpnt:
location by placing the cursor over Ask and pressing ENTER .
(Remember that the other settings on this screen do not matter
if you are using
Ask.)
Press 2nd GRAPH (TABLE). Delete any values that appear
by placing the cursor over the first
X value and repeatedly
pressing
DEL . To numerically estimate
lim
x→ ∞
u(x), enter
increasingly large values of x. (Note: The values you enter do
not have to be those shown in the text or these shown to the
right provided the values you input increase without bound.)
CAUTION: Your instructor will very likely have you write the table you construct on paper.
Be certain to highlight the rounded values in the output column of the table and look on the
bottom of the screen to see what these values actually are.
ROUNDING OFF: Recall that rounded off (also called rounded in this Guide) means that if
one digit past the digit of interest is less than 5, other digits past the digit of interest are
dropped. If one digit past the one of interest is 5 or over, the digit of interest is increased by 1
and the remaining digits are dropped.
RULE OF THUMB FOR DETERMINING LIMITS FROM TABLES: Suppose that you
are asked to give
lim
x→ ∞
u(x) accurate to 3 decimal places. Observe the Y1 values in the table until
you see that the output is the same value to one more decimal place (here, to 4 decimal places)
for 3 consecutive outputs. Then, round the last of the repeated values off to the requested 3
places for the desired limit. Your instructor may establish a different rule from this one, so be
sure to ask.
Using this Rule of Thumb and the results that are shown on the last calculator screen, we
estimate that, to 3 decimal places,
lim
x→ ∞
u(x) = 0.300. We now need to estimate
lim
x→
−
∞
u(x).
Delete the values currently in the table with DEL . To estimate
the negative end behavior of u, enter negative values with
increasingly large magnitudes.
(Note: Again, the values that
you enter do not have to be those shown in the text or these
shown to the right.)
Because the output 0.2999… appears three times in a row, we estimate
lim
x→
−
∞
u(x) = 0.300.
CAUTION: It is not the final value, but a sequence of several values, that is important when
determining limits. If you enter a very large or very small value, you may exceed the limits of
the calculator’s capability and obtain an incorrect number. Always look at the sequence of
values obtained to make sure that all values that are found make sense.
GRAPHICALLY ESTIMATING END BEHAVIOR The graph of the function u in Example
3 of Section 1.4 in Calculus Concepts can be used to confirm our numerically estimated end
behavior. Even though the
ZOOM menu of the calculator can be used with this process for some
functions, the graph of u is lost if you use
Option 3 in the ZOOM menu (Zoom Out). We therefore
manually set the window to zoom out on the horizontal axis.
Copyright © Houghton Mifflin Company. All rights reserved.
36

 Loading...


