Chapter 1
Delete the values currently in the table
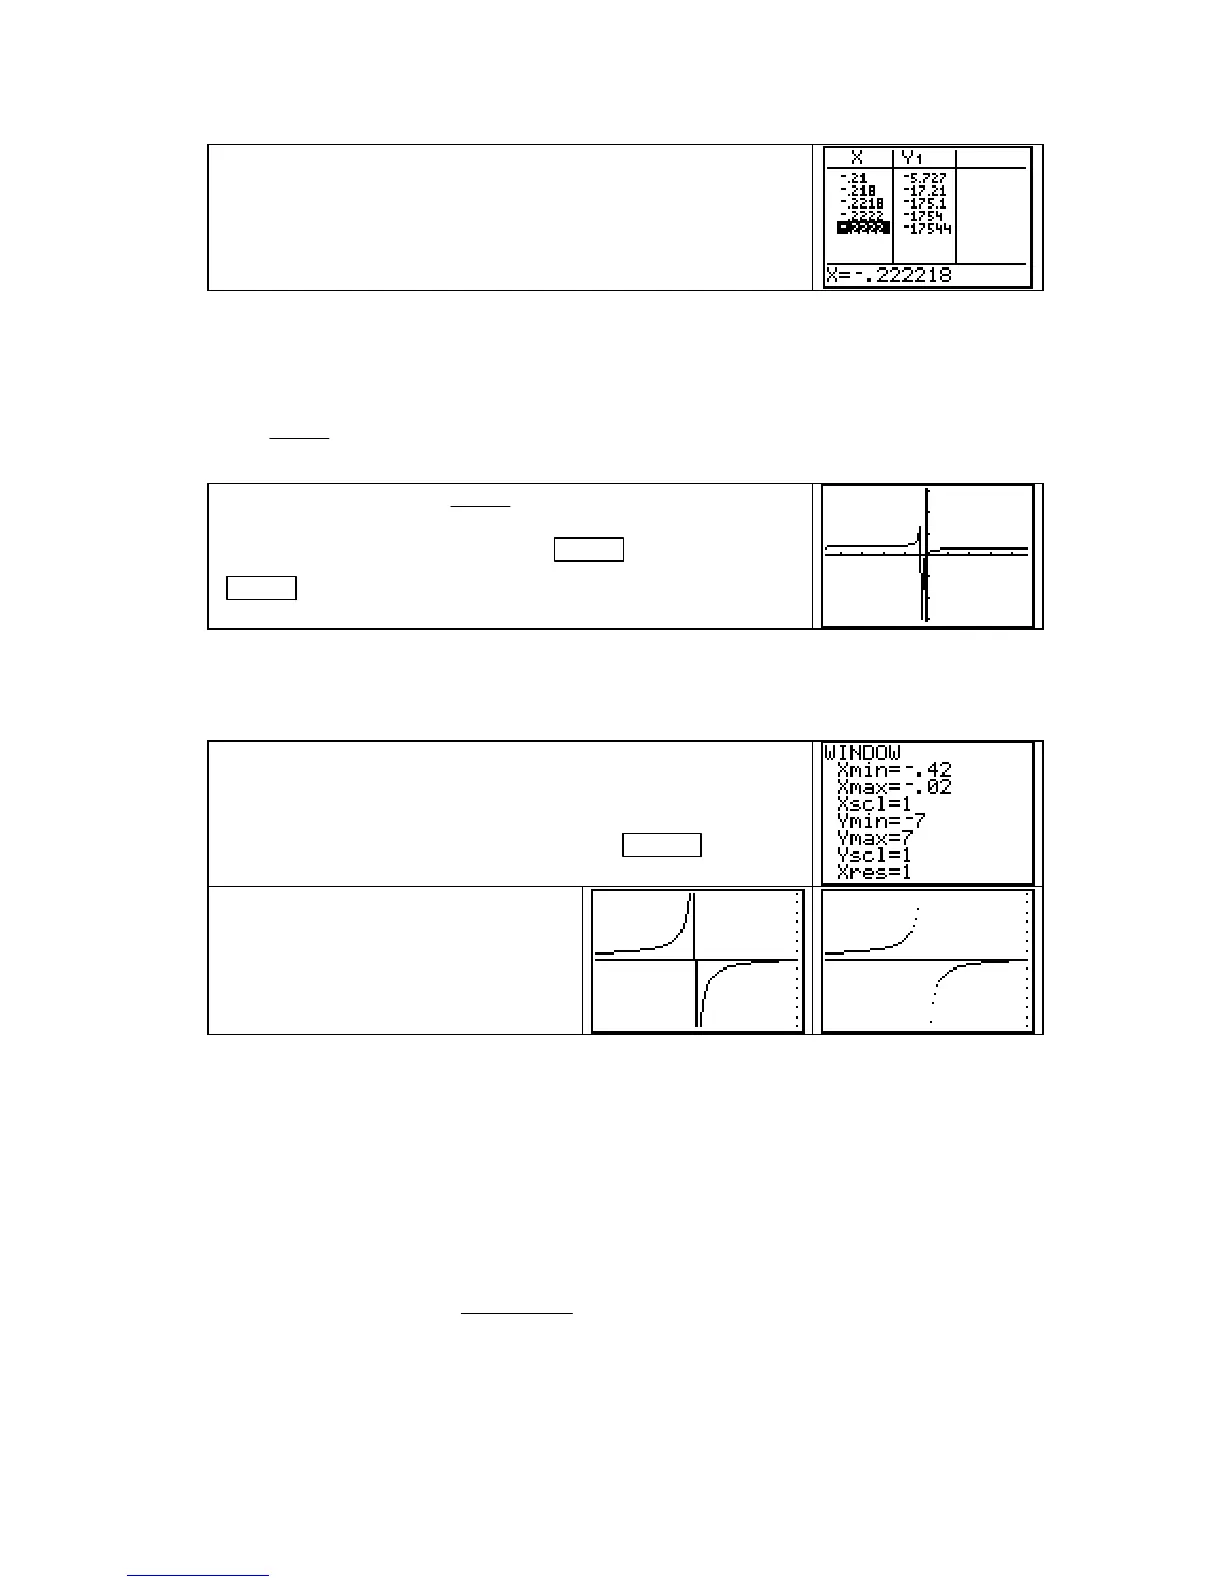
. To numerically estimate
lim
x→
−
2/9
+
u(x), enter values to the right of, and closer and closer
to,
−
2/9. Because the output values appear to become larger and
larger, we estimate that
lim
x→
−
2/9
+
u(x) →
−
∞.
GRAPHICALLY ESTIMATING THE LIMIT AT A POINT
A graph can be used to
estimate a limit at a point or to confirm a limit that you estimate numerically. The procedure
usually involves zooming in on a graph to confirm that the limit at a point exists or zooming
out to validate that a limit does not exist. We again illustrate using the function
u(x) =
3
92
x +
.
Have the function u(x) =
3
92
x +
entered in some location of the
Y= list, say Y1. A graph drawn with ZOOM 4 [ZDecimal] or
ZOOM
6 [ZStandard] is not very helpful.
To confirm that
lim
x→
−
2/9
−
u(x) and
lim
x→
−
2/9
+
u(x) do not exist, we are interested in values of x that
are near to and on either side of
−
2/9.
Choose input values close to
−
0.222222... for the x-view and
experiment with different y values until you find an appropriate
vertical view. Use these values to manually set a window such as
that shown to the right. Draw the graph with
GRAPH .
The vertical line appears because the
TI-83 is set to
Connected mode. Place
the TI-83 in
Dot mode or place the
function
Y1 in the Y= list in Dot mode
(see page A16) and redraw the graph.
It appears from this graph that as x approaches
−
2/9 from the left that the output values increase
without bound and that as x approaches
−
2/9 from the right that the output values decrease
without bound. Choosing smaller
Ymin values and larger Ymax values in the Window and
tracing the graph as x approaches
−
2/9 from either side confirms this result.
Graphically Estimating a Limit at a Point when the Limit Exists: The previous illustrations
involved zooming on a graph by manually setting the window. You can also zoom with the
ZOOM menu of the calculator. We next describe this method by zooming in on a function for
which the limit at a point exists.
Have the function h(x) =
33
911
2
2
xx
xx
+
++2
entered in the Y1 location of the Y= list. Suppose
that we want to estimate
lim
x→
−
1
h(x).
Copyright © Houghton Mifflin Company. All rights reserved.
38