Chapter 2
Use the arrow keys to move the cursor to the opposite corner of
your “zoom” box. Point A should be close to the center of your
box.
Press ENTER to magnify the portion of the graph that is inside
the box. Look at the dimensions of the view you now see with
WINDOW . Repeat the above process if necessary. The closer
you zoom in on the graph, the more it looks like a line.
Reset Xmin to 0, Xmax to 12, and redraw the graph of T with ZoomFit. Repeat the zoom and
box steps for point B with x = 7.24 and point C with x = 9. Note for each point how the graph
of the parabola looks more like a line the more you magnify the view. These are illustrations
of local linearity.
DRAWING A TANGENT LINE The DRAW menu of the calculator contains the
instruction to draw a tangent line to the graph of a function at a point. To illustrate the
process, we draw several tangent lines on the graph of T, the temperature function given in the
previous section of this Guide.
Enter T(x) =
−
0.804x
2
+ 11.644x + 38.114 in Y1. Next, press
WINDOW and set Xmin = 0, Xmax = 12, Ymin = 38, and Ymax
= 85.
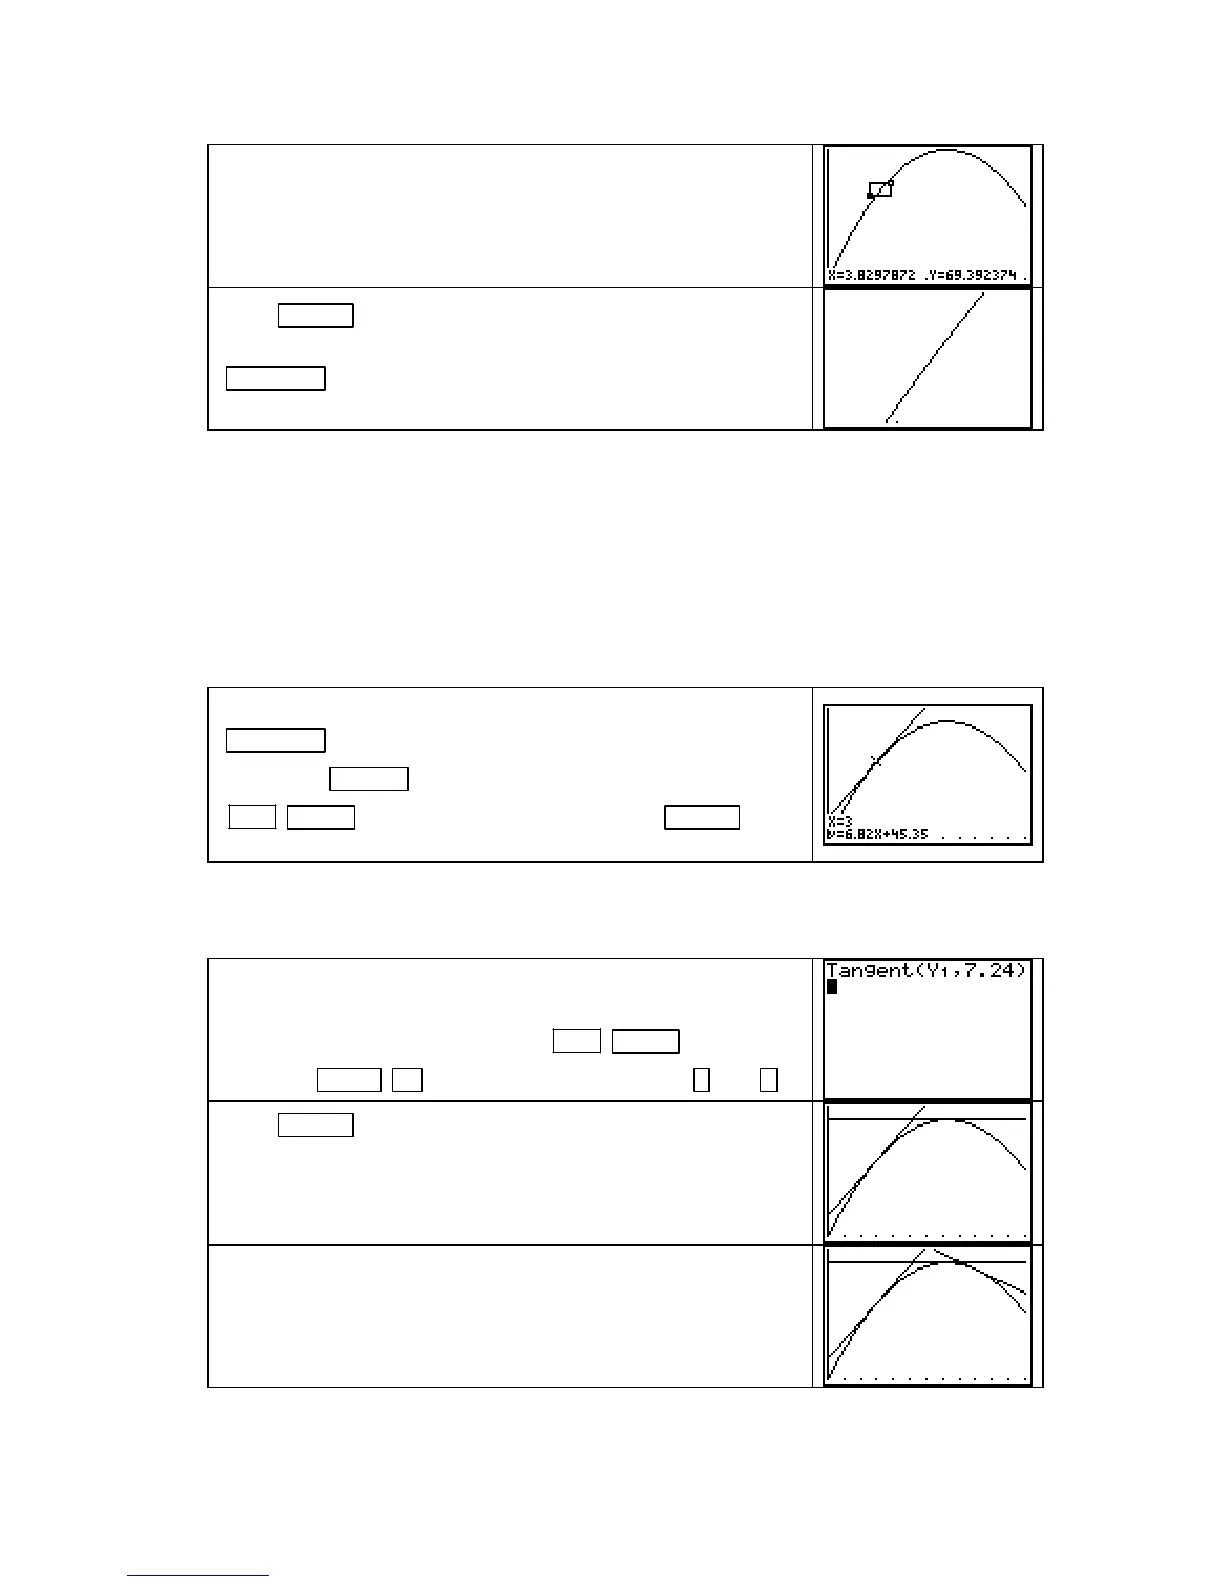
Press GRAPH . With the graph on the screen, press
2ND PRGM (DRAW) 5 [Tangent(], then press 3 ENTER , and
the tangent line is drawn at
x = 3.
Note that the equation of the tangent line and the input value of the point of tangency are dis-
played at the bottom of the screen. Compare this line with the zoomed-in view of the curve at
point A (in the previous section). They actually are the same line if you are at point A!
We illustrate a slightly different method to draw the tangent line
to the curve at point B where x = 7.24.
Return to the home screen and press
2ND PRGM (DRAW) 5
[Tangent(] VARS
► [Y−VARS] 1 [Function] 1 [Y1] , 7.24 ) .
Press ENTER and the tangent line is drawn at the high point of
the parabola. Compare this line with the zoomed-in view of the
curve at point B (in the previous section). Note that this method
of drawing the tangent line shows neither the equation of the
tangent nor the point of tangency.
Choose the method you prefer from the two methods given
above and draw the tangent at point C where x = 9.
(Compare your graph with the one shown in Figure 2.9 in
Section 2.2 of the text.)
Copyright © Houghton Mifflin Company. All rights reserved.
46

 Loading...


