TI-83, TI-83 Plus, TI-84 Plus Guide
Chapter 4 Analyzing Change:
Applications of Derivatives
4.2 Relative and Absolute Extreme Points
Your calculator can be very helpful for checking your analytic work when you find optimal
points and points of inflection. When you are not required to show work using derivative
formulas or when an approximation to the exact answer is all that is required, it is a simple
process to use your calculator to find optimal points and inflection points.
FINDING
X
-INTERCEPTS OF SLOPE GRAPHS Where the graph of a function has a
relative maximum or minimum, the slope graph has a horizontal tangent. Where the tangent
line is horizontal, the derivative of the function is zero. Thus, finding where the slope graph
crosses the input axis is the same as finding the input of a relative extreme point.
Consider, for example, the model for Acme Cable Company’s revenue for the 26 weeks
after it began a sales campaign, where x is the number of weeks since Acme began sales:
R(x) =
−
3x
4
+ 160x
3
– 3000x
2
+ 24,000x dollars
In Example 2 of Section 4.2 of Calculus Concepts, we are first asked to determine when
Acme’s revenue peaked during the 26-week interval.
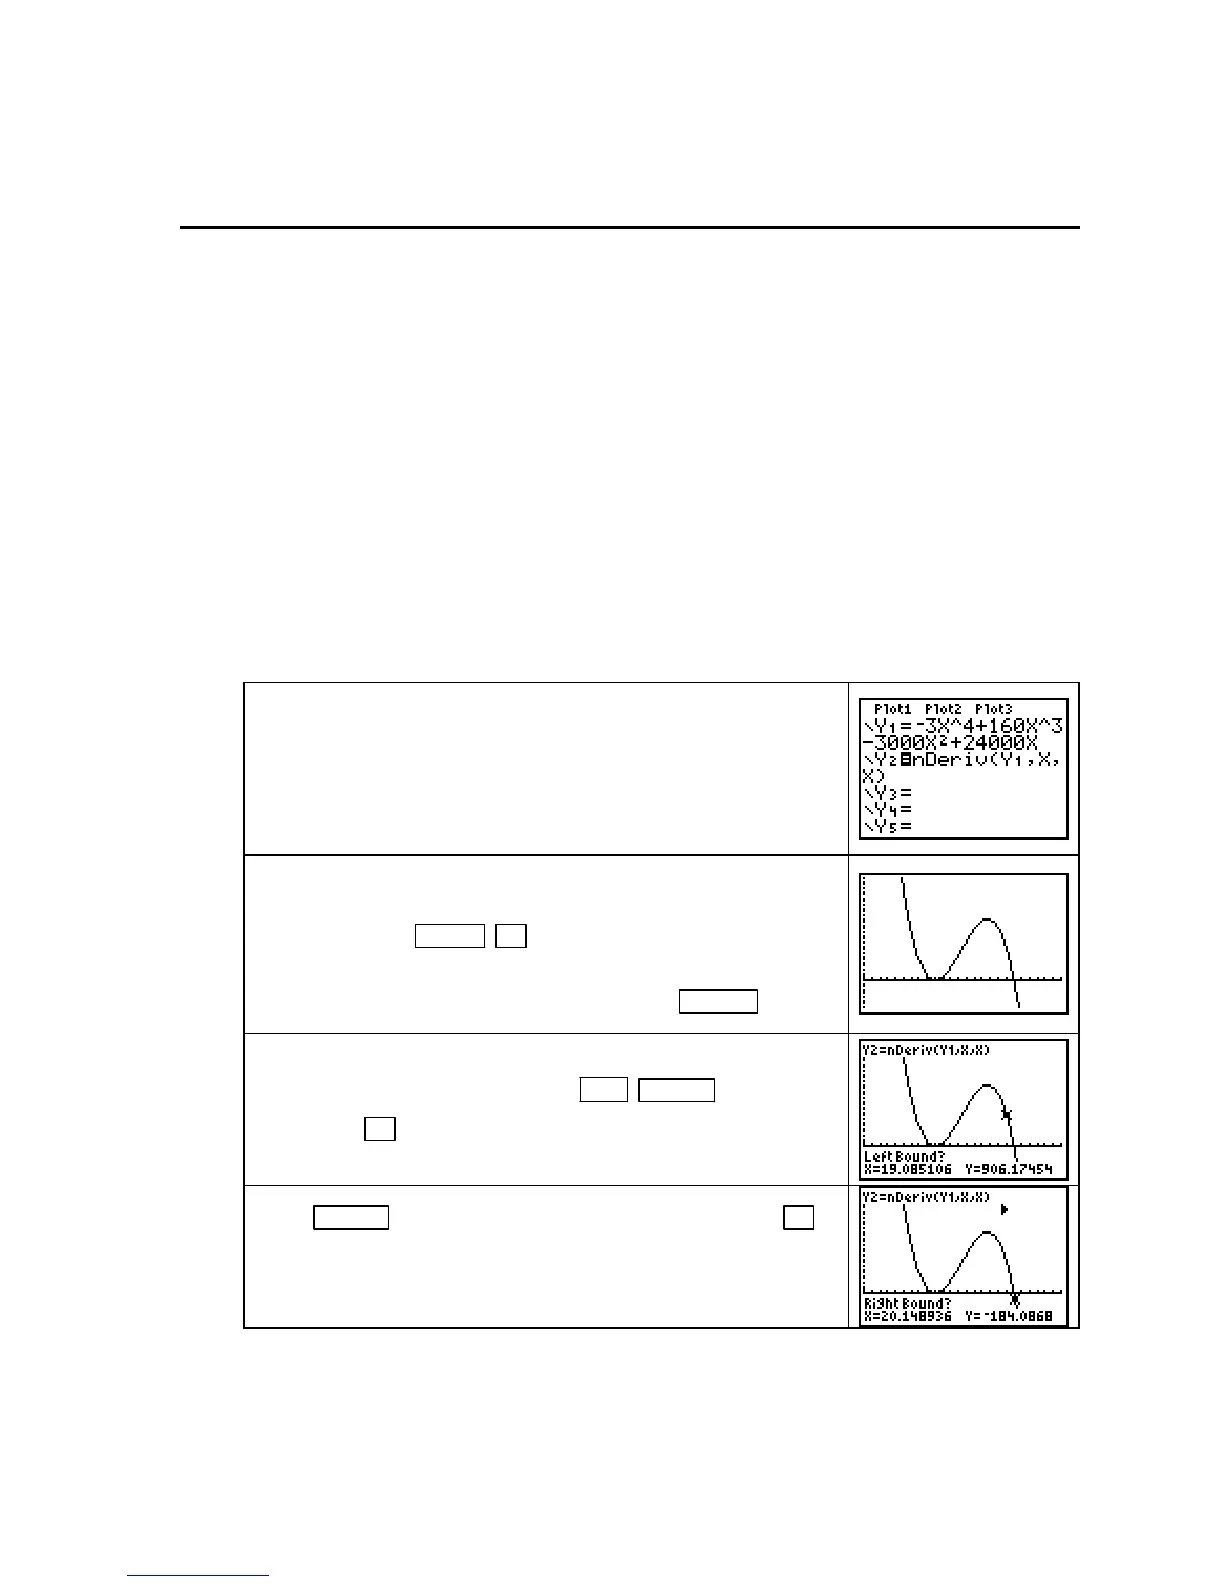
Enter R in the Y1 location of the Y= list. Enter either the
calculator’s derivative or your derivative in the
Y2 location.
Turn off
Y1.
(If you use your derivative, be sure to use one of the methods at
the end of Chapter 3 in this Guide to check that your derivative
and the calculator derivative are the same.)
The statement of the problem indicates that x should be graphed
between 1 and 26. Set this horizontal view, and draw the slope
graph in
Y2 with ZOOM ▲ [ZoomFit]. For a better view to
use in this illustration, reset the window values to
Ymin =
−
800
and Ymax = 3000. Redraw the slope graph with GRAPH .
Find the intercepts of the slope graph using the CALC menu.
With the graph on the screen, press
2ND TRACE (CALC) 2
[zero].
Use ► to move the cursor near to, but still to the left
of, the rightmost x-intercept.
Press ENTER to mark the location of the left bound. Use ►
to move the cursor near to, but to the right of, the rightmost x-
intercept.
• Note that the calculator has marked (at the top of the screen) the left bound with a small
triangle. The right bound will be similarly marked. The x-intercept must lie between
these two bound marks. If you incorrectly mark the interval, you may not get an answer.
Copyright © Houghton Mifflin Company. All rights reserved.
59

 Loading...


