TI-83, TI-83 Plus, TI-84 Plus Guide
Enter f in the
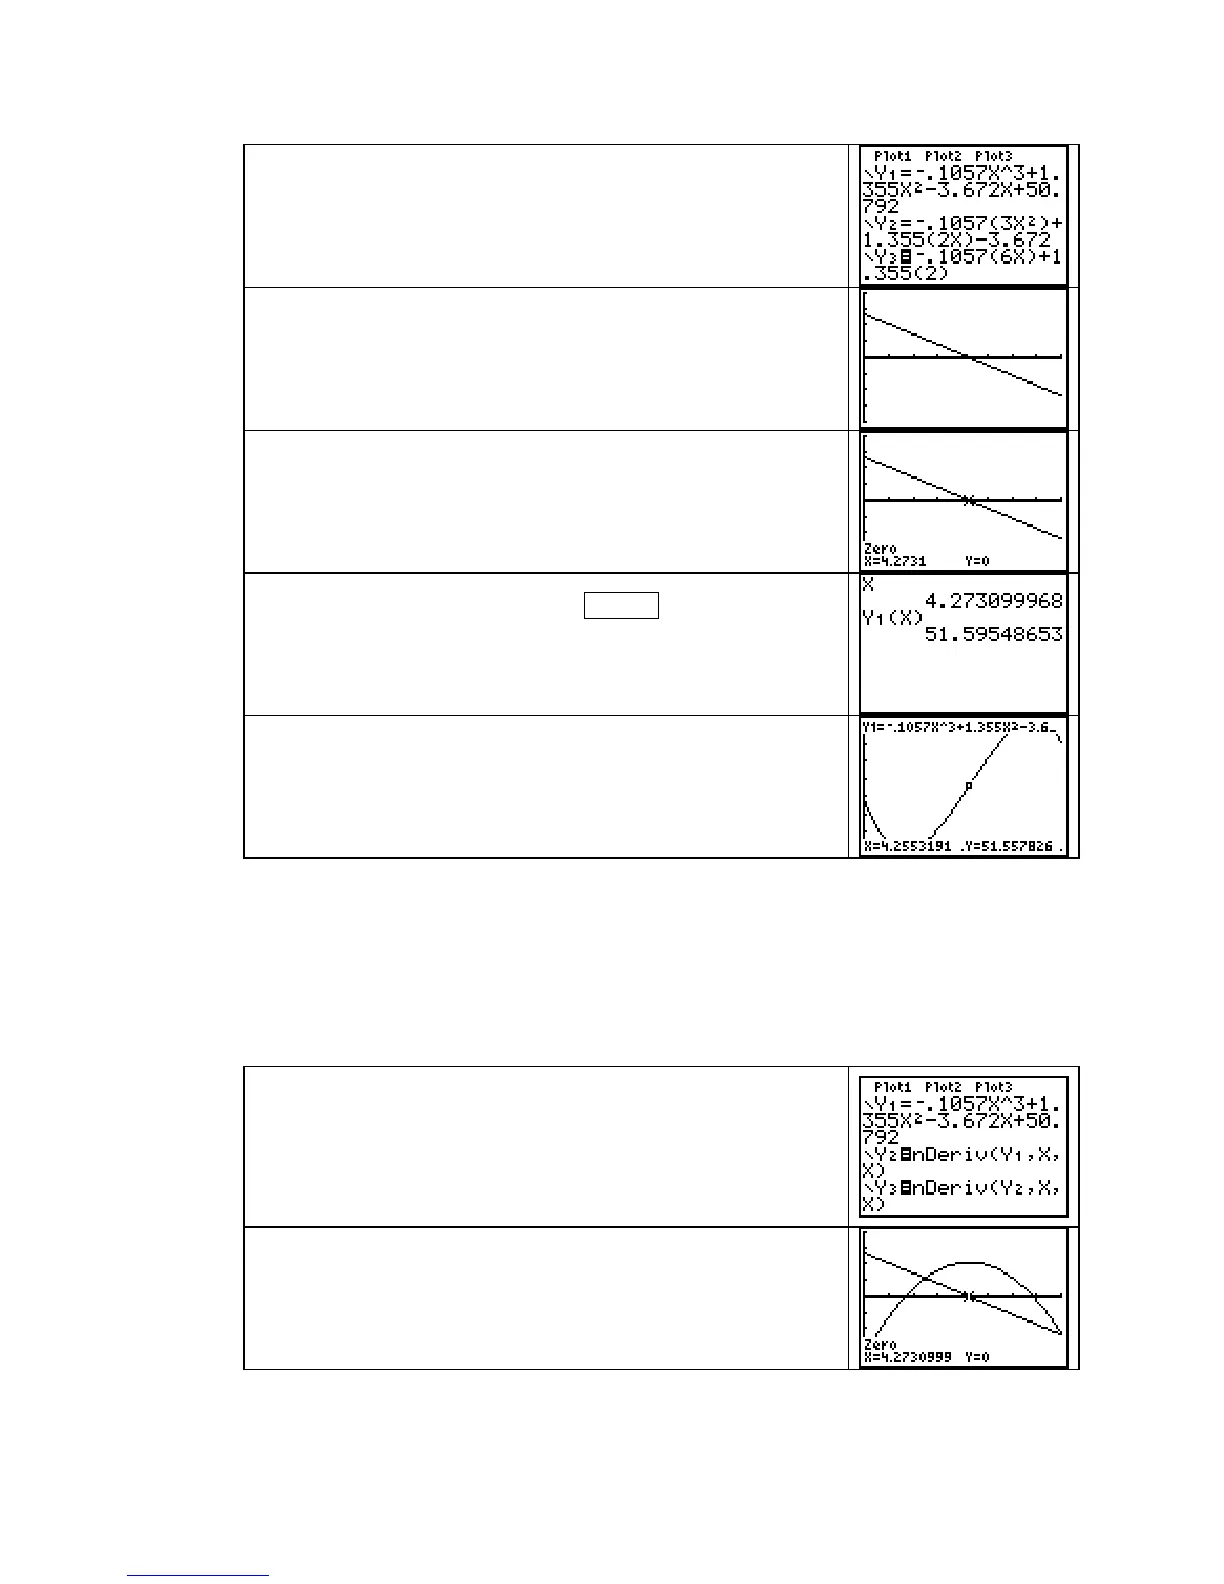
Y1 location of the Y= list, the first derivative of f
in
Y2, and the second derivative of f in Y3. (Be careful not to
round any decimal values.)
Turn off
Y1 and Y2.
We are given the input interval 1982 through 1990, so 0 ≤ x ≤ 8.
Either use
ZoomFit or choose some appropriate vertical view.
We use
−
4 ≤ y ≤ 4. Because we are looking for the x-intercept(s)
of the second derivative graph, any view that shows the line
crossing the horizontal axis is okay to use.
Use the methods indicated on pages 61 and 62 of this Guide to
find where the second derivative graph crosses the x-axis.
(Note that when you are asked for the inflection point of f, give
both the input and an output of the original function.)
Return to the home screen and enter X,T,θ,n . The x-value you
just found as the x-intercept remains stored in the X location
until you change it by tracing, using the
SOLVER, and so forth.
Find the y-value by substituting this x-value into
Y1.
At some point, be sure to examine a graph of the function and
verify that an inflection point does occur at the point you have
found. To do this, turn off
Y3, turn on Y1, and use ZoomFit to
draw the graph. Trace near where x ≈ 4.27 and y ≈ 51.6. The
graph of R confirms that an inflection point occurs at this point.
• The calculator will usually draw an accurate graph of the first derivative of a function
when you use
nDeriv(. However, this calculator does not have a built-in method to
calculate or graph f
′′
, the second derivative. As illustrated below, you can try to use
nDeriv(f
′
, X, X) to find f
′′
. Be cautioned, however, that nDeriv(f
′
, X, X) sometimes “breaks
down” and gives invalid results. If this should occur, the graph of
nDeriv(f
′
, X, X) appears
very jagged and this method should not be used.
Enter f in the Y1 location of the Y= list, the first derivative of f
in
Y2, and the second derivative of f in Y3, using the
calculator’s numerical derivative for each derivative that you
enter.
Turn off
Y1. Be sure that Xmin = 0 and Xmax = 8 (as the
problem directions indicate.)
Draw the graph of the first derivative (Y2) and the second
derivative
(Y3) of f using an appropriate window. You can use
ZoomFit to set the vertical view or experiment until you find a
suitable view. The graph to the right uses
−
4 ≤ y ≤ 4.
Copyright © Houghton Mifflin Company. All rights reserved.
63

 Loading...


