TI-83, TI-83 Plus, TI-84 Plus Guide
We add the demand function for the gasoline example used on page A-87 of this
guide to calculate producers’ willingness and ability to receive. The demand and
supply functions for the gasoline example in the text are given by D(p) = 5.43(0.607
p
)
million gallons and S(p) = 0 million gallons for p < 1 and S(p) = 0.792p
2
– 0.433p +
0.314 million gallons for p
≥ 1 when the market price of gas is p dollars per gallon.
First, let’s find the market equilibrium point. This point can be found graphically using the
intersection command and the graphs of the functions, but we choose to use the
SOLVER.
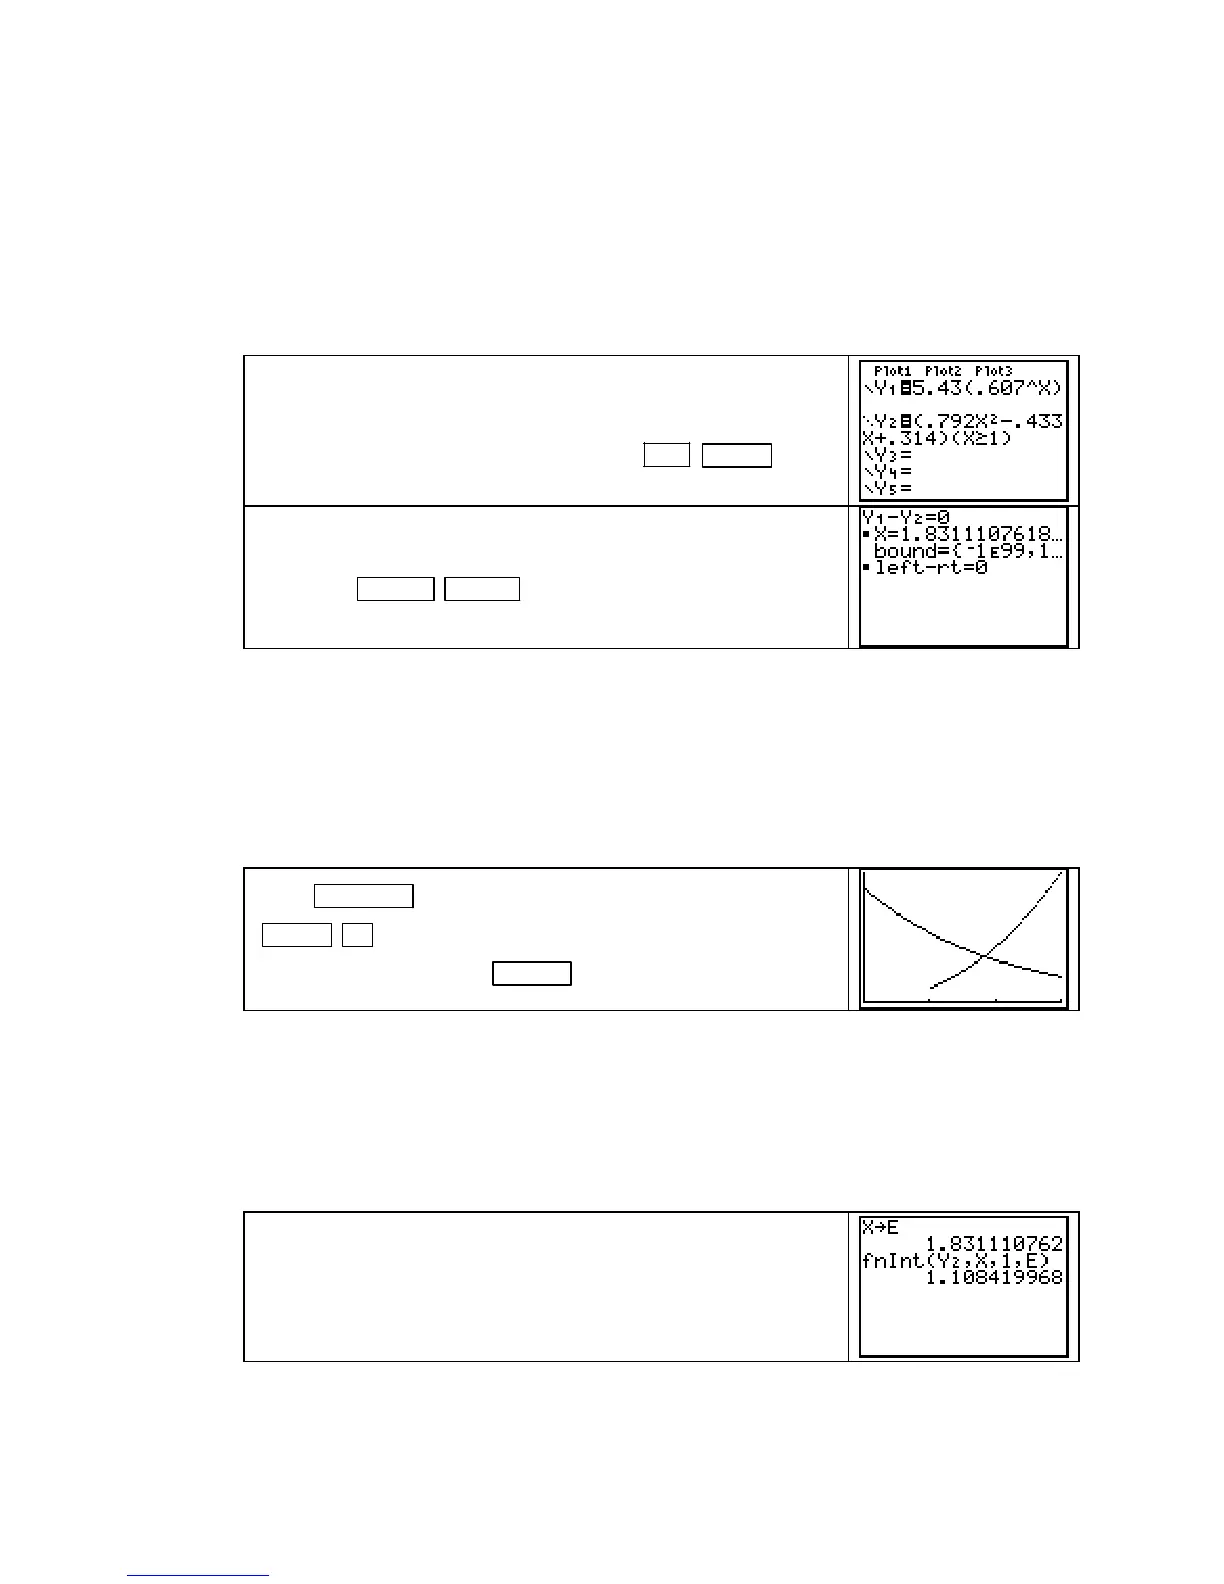
Enter D in Y1. Enter S (for p ≥ 1) in Y2 as shown to the right.
Use
X as the input variable in each function. Recall that you
need to enclose the piecewise function and its input in paren-
theses. Access the inequality symbol with
2ND MATH 4 [≥].
Because we intend to draw a graph of S, put Y2 in Dot mode.
Access the SOLVER and enter the equation Y1 – Y2 = 0. Enter
a guess for the equilibrium point. With the cursor on the
X
line, press
ALPHA ENTER (SOLVE) to find X ≈ 1.8331.
Store this value in some memory location, say E.
NOTE: Is X ≈ 1.8331 the only solution to the equation Y1 – Y2 = 0? Enter more guesses for
X, some large and some small. Each time the solution shown above results, so it appears that
there is only one solution.
We next draw graphs of the demand and supply functions. How do we set the window to
draw the graphs? Notice that because D is an exponential function, it will never cross the
input axis. Because S is a concave-up parabola, it also increases when
X > 1. Therefore, just
try several different
Xmax values and choose an Xmax so that the graphs can be viewed.
Press WINDOW , set Xmin = 0 and we choose Xmax = 3. Use
ZOOM ▲ [ZoomFit] to draw the graphs of D and S. If Ymin is
not 0, set it to 0 and press
GRAPH .
Note that there is only one point of intersection for the two functions, the market equilibrium
point with input
X ≈ 1.8331. Recall that we stored the complete value of X in E.
Total social gain = producers’ surplus + consumers’ surplus at the equilibrium price. Shade
this area on your graph and then use the graph to write the integrals that give this area:
Social gain =
() ()
1
E
E
Spdp Dpdp
+
∞
where E ≈ 1.8331
Find the producer’s surplus as shown to the right.
The calculator does not calculate the value of improper
integrals. However, as a check on your algebraic work to
determine the value of the consumer’s surplus, you can do the
following.
Copyright © Houghton Mifflin Company. All rights reserved.
87

 Loading...


