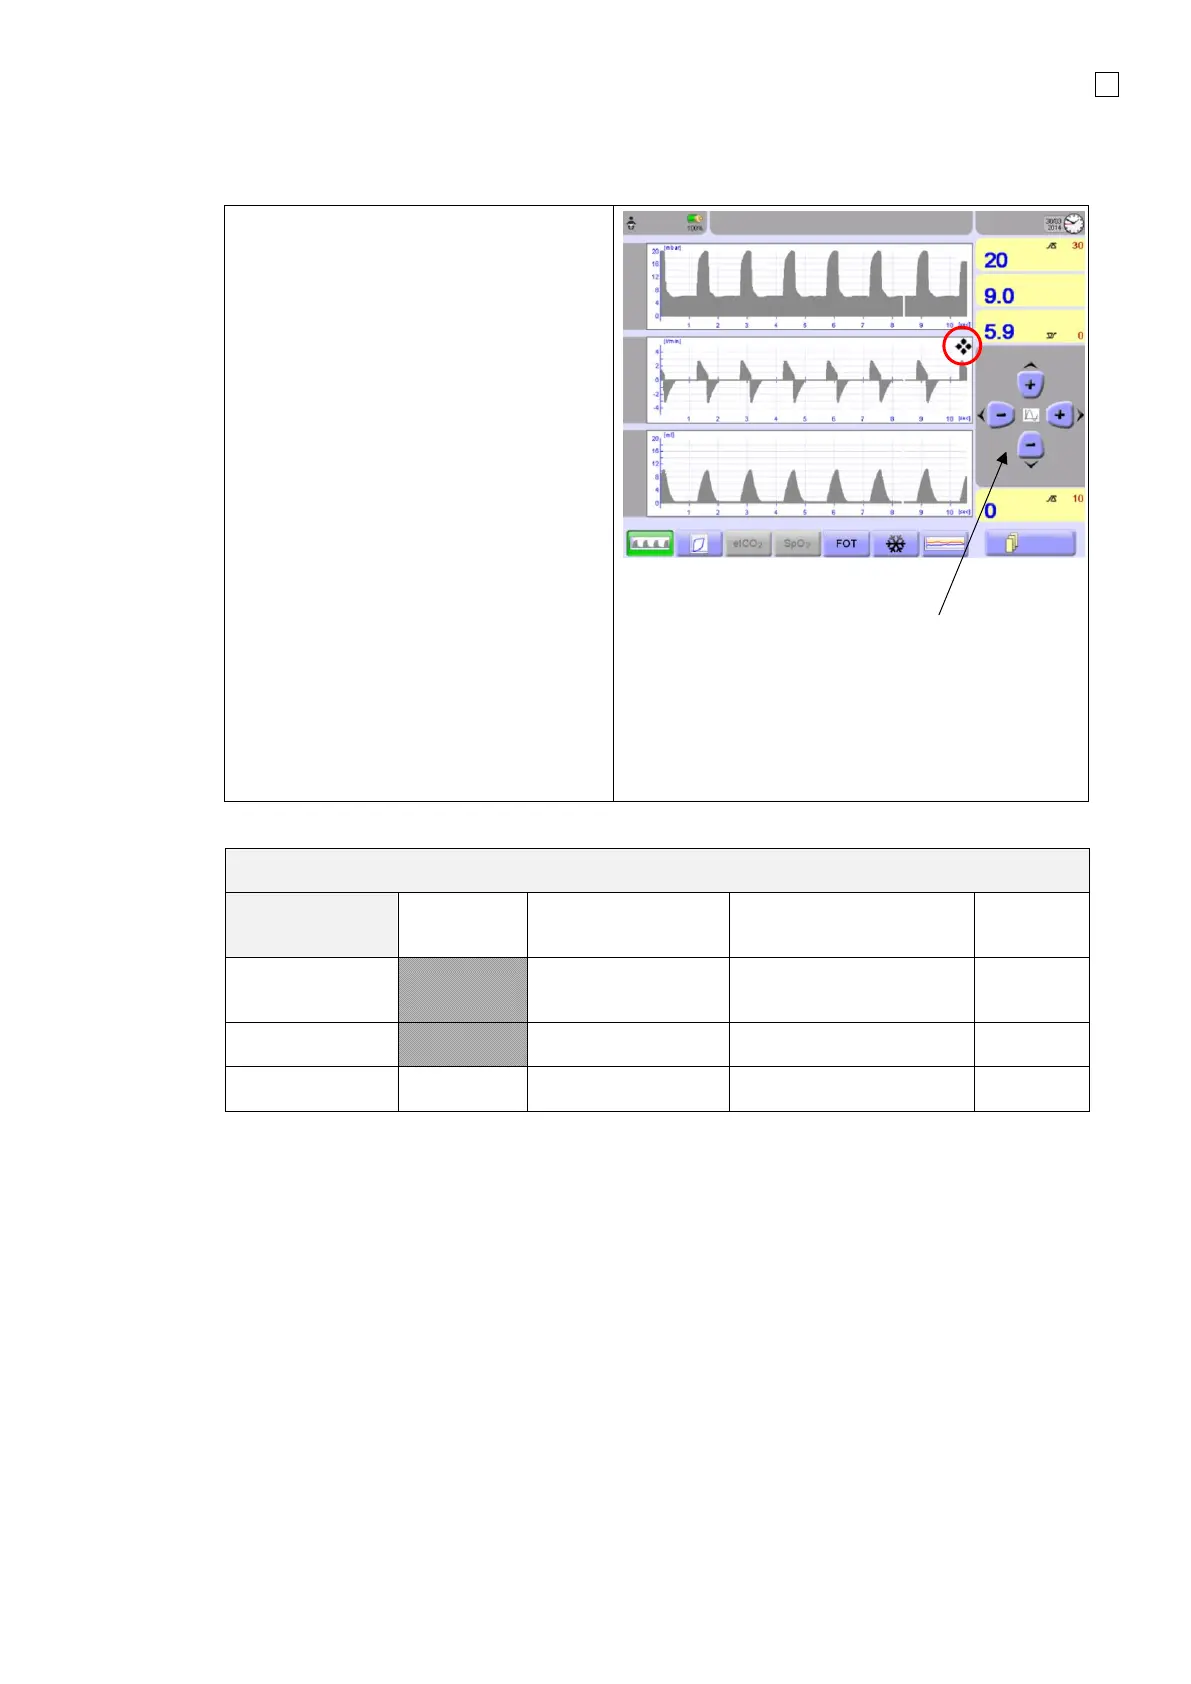
The Graphics menu shows the following
curves:
• Pressure
• Flow
• Volume
When auto-scaling of graphics is
switched OFF, the graph can be adjusted
manually:
1. Select desired graph.
2. Press the graph.
3. The selected graph is marked with
the “Cursor” symbol and the
Scaling cursor is displayed.
4. Use the cursor to scale the graph in
the X and Y direction.
The cursor disappears if not used within
five seconds, or by tapping the selected
graph again.
 Loading...