Displaying Data 2-11
March 2008
Displaying the
Transducer Signal
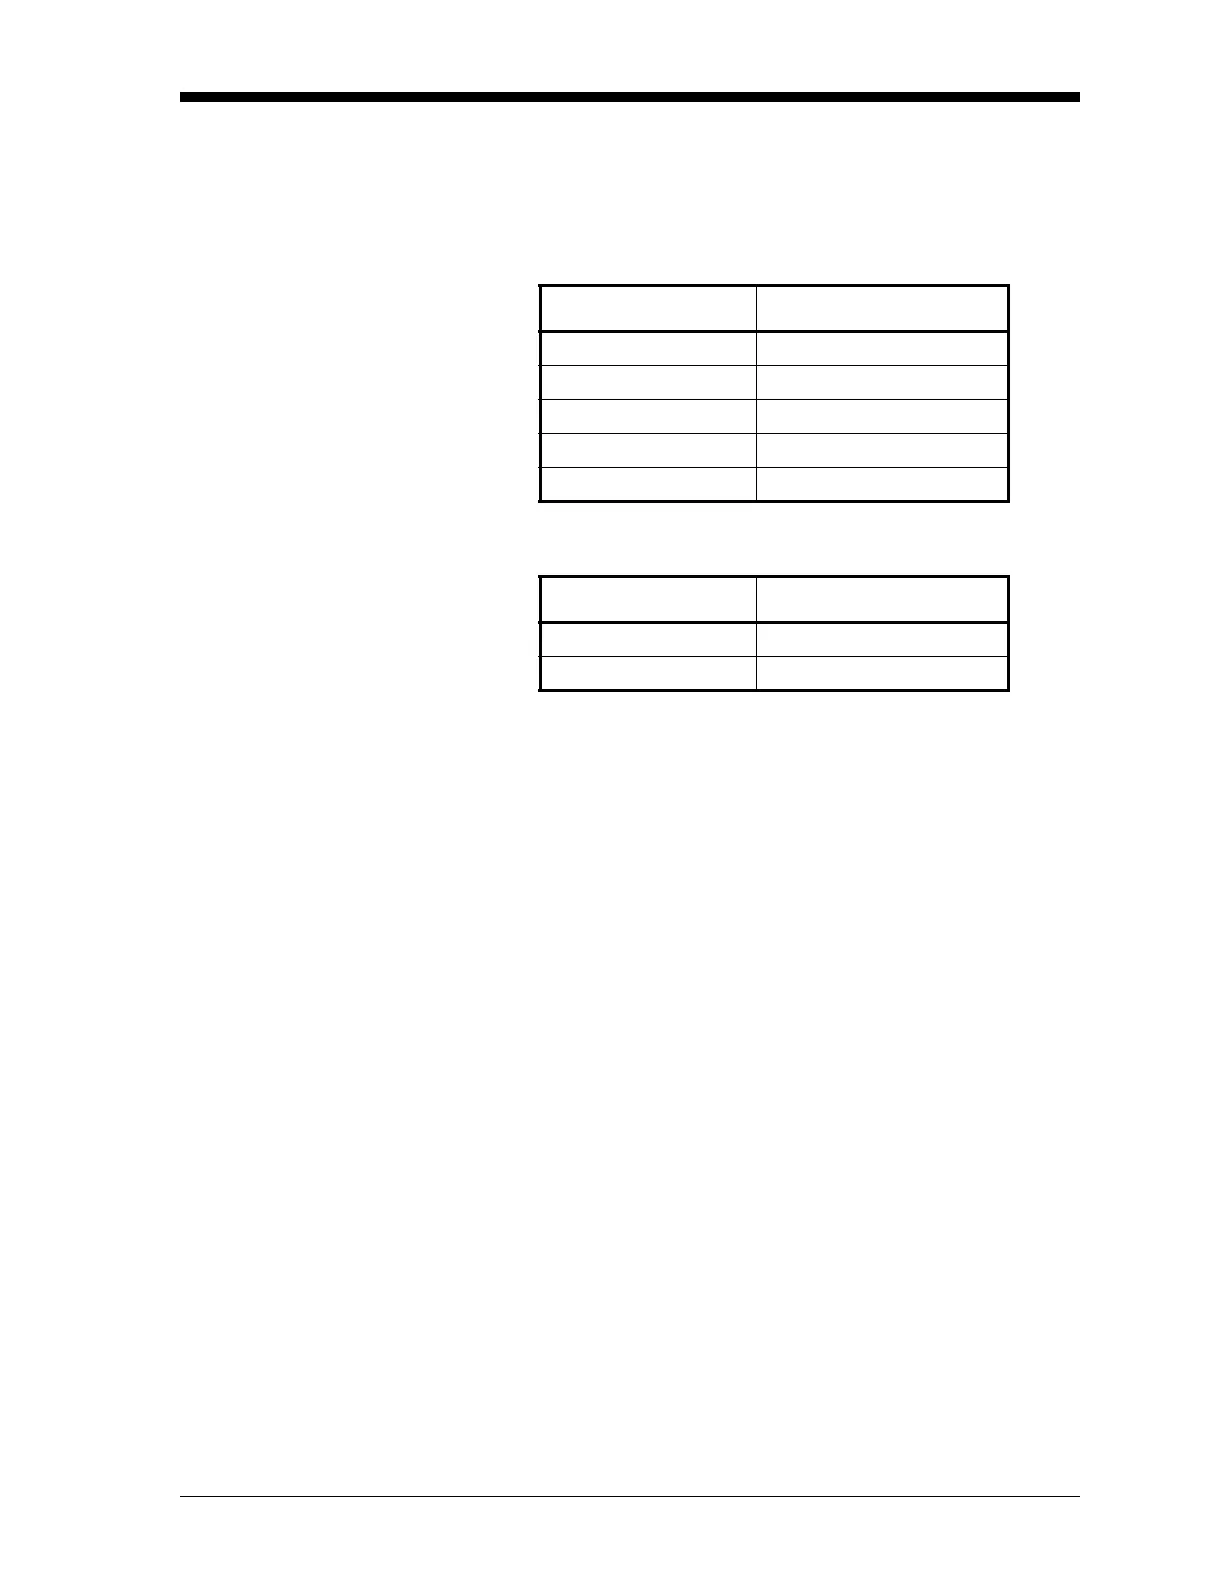
The SIGNL submenu permits the direct graphical display of several
transducer signals. Specifically, the signals listed in Table 2-5 and
Table 2-6 below may be viewed in this format.
Complete the following steps to display the transducer signals:
Press the appropriate side of the
[SCREEN] key to activate the desired
pane of the display screen, then proceed as follows:
Note: For this discussion, it is assumed that the left pane of the
display screen is active. If the right pane is active, it is only
necessary to replace the
[F1]-[F4] keys designations by the [F5]-
[F8]
keys.
1. To access the Display Menu, press the
[DISP] key.
2. Press [→] and
[F1] = SIGNL.
The signal graph is a plot of signal amplitude (y-axis) vs. time in
microseconds (x-axis). When the
SIGNL display screen first appears, it
may briefly remain blank. As soon as the signal is acquired,
processed and loaded into the display memory, the graph will appear.
A cursor, which is displayed as a vertical line that extends the full
height of the graph window, is used to highlight any point in time
along the x-axis.
3. Use the [←], [→] and
[F1]-[F4] keys to select the desired option.
The options are listed in Table 2-7 on page 2-12.
Table 2-5: Transit-Time Transducer Signals
Transducer Signal Description
Sup upstream signal
Sdown downstream signal
Cup upstream correlation
Cdown downstream correlation
CC cross-correlation
Table 2-6: TransFlection Transducer Signals
Transducer Signal Description
Corr correlated signal
Sig receive signal
 Loading...